

KNAT1 and ERECTA regulate inflorescence architecture in Arabidopsis
- PMID: 11910003
- PMCID: PMC150578
- DOI: 10.1105/tpc.010391
KNAT1 and ERECTA regulate inflorescence architecture in Arabidopsis
Abstract
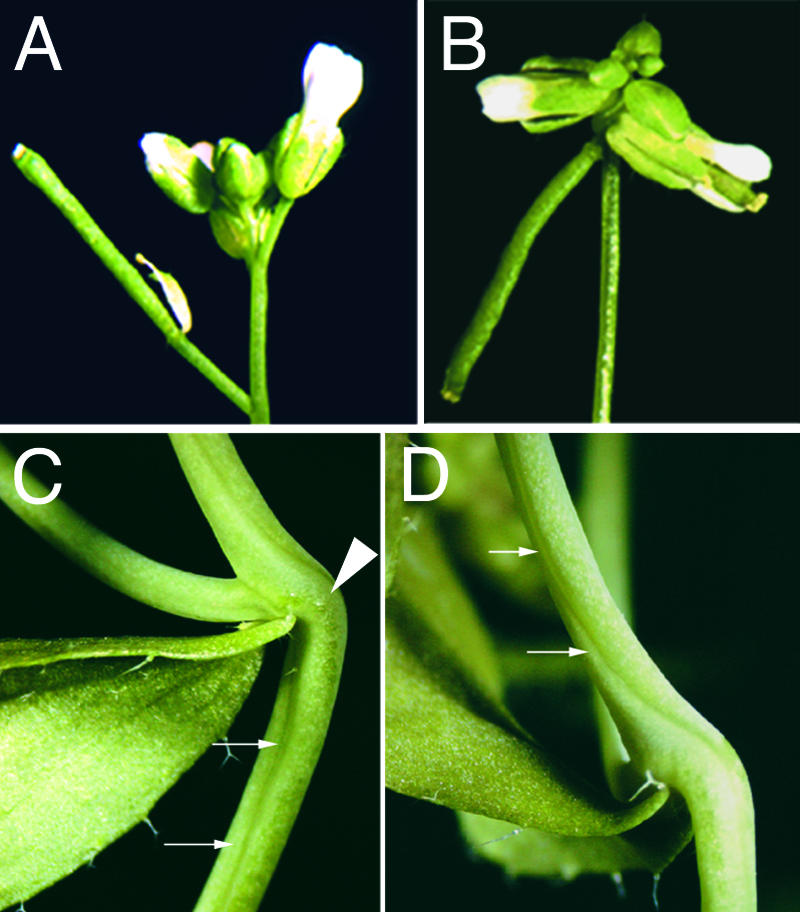
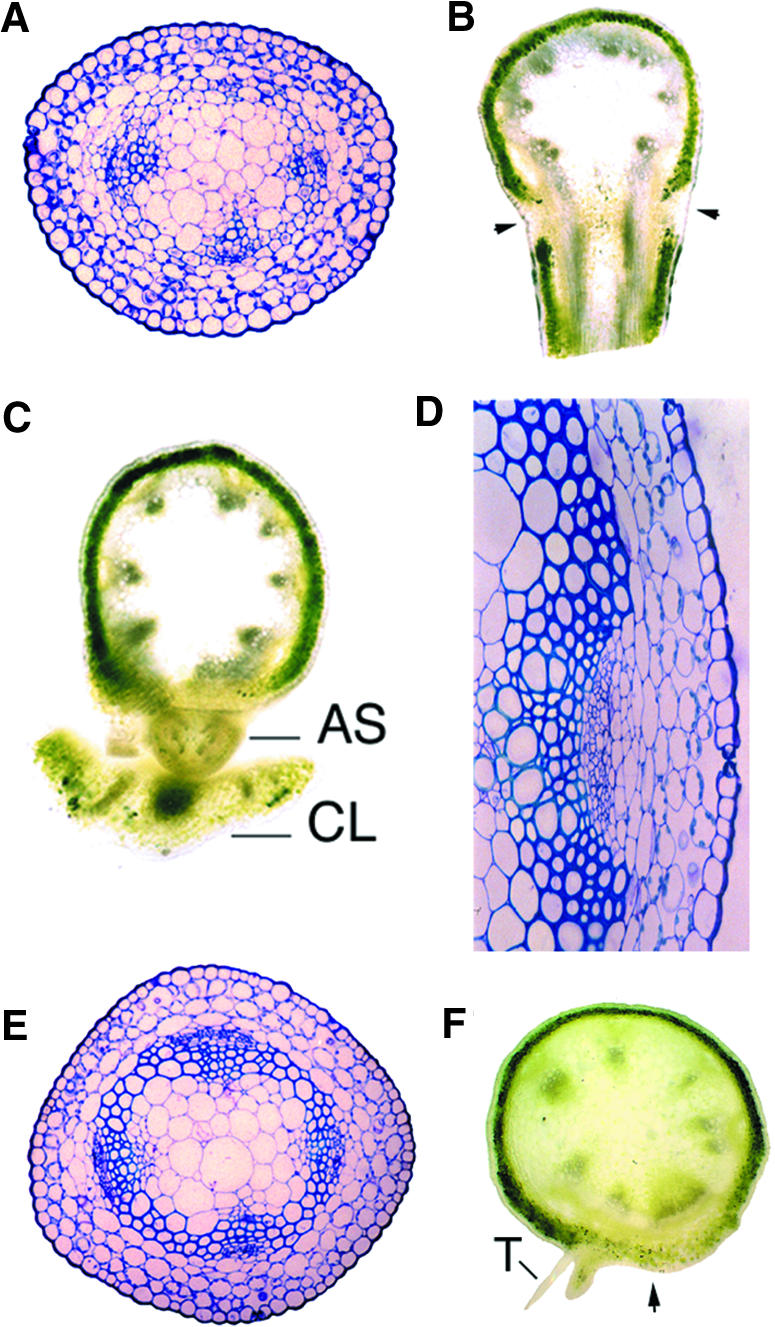
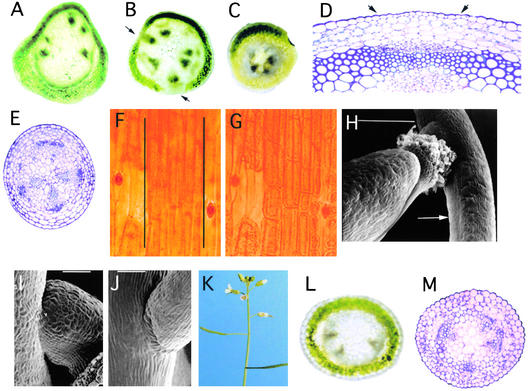
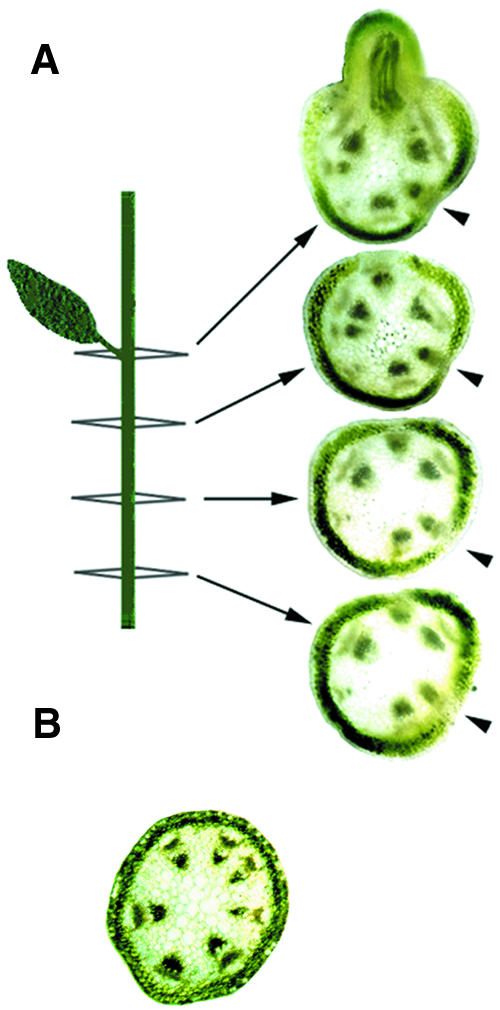
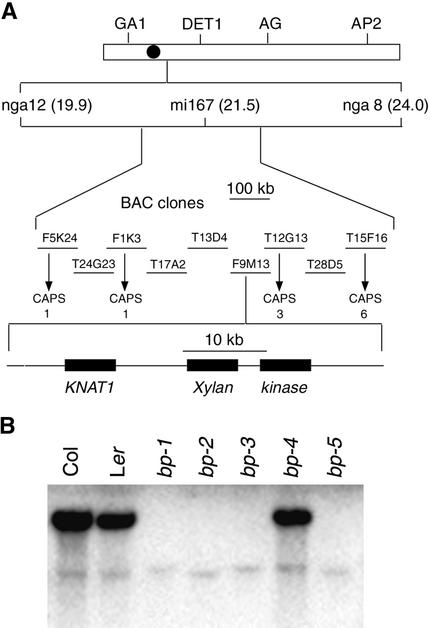
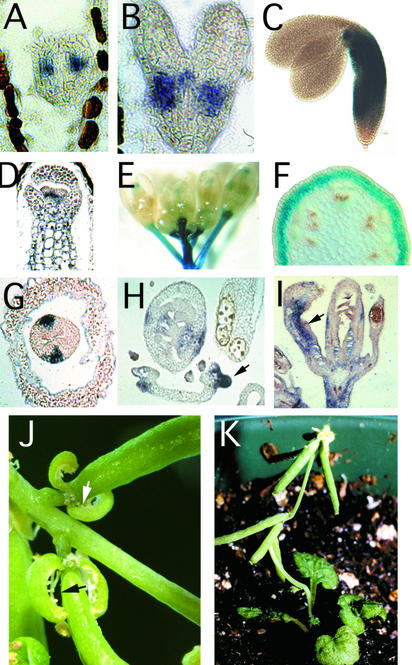
Plant architecture is dictated by morphogenetic factors that specify the number and symmetry of lateral organs as well as their positions relative to the primary axis. Mutants defective in the patterning of leaves and floral organs have provided new insights on the signaling pathways involved, but there is comparatively little information regarding aspects of the patterning of stems, which play a dominant role in architecture. To this end, we have characterized five alleles of the brevipedicellus mutant of Arabidopsis, which exhibits reduced internode and pedicel lengths, bends at nodes, and downward-oriented flowers and siliques. Bends in stems correlate with a loss of chlorenchyma tissue at the node adjacent to lateral organs and in the abaxial regions of pedicels. A stripe of achlorophyllous tissue extends basipetally from each node and is positioned over the vasculature that services the corresponding lateral organ. Map-based cloning and complementation studies revealed that a null mutation in the KNAT1 homeobox gene is responsible for these pleiotropic phenotypes. Our observation that wild-type Arabidopsis plants also downregulate chlorenchyma development adjacent to lateral organs leads us to propose that KNAT1 and ERECTA are required to restrict the action of an asymmetrically localized, vasculature-associated chlorenchyma repressor at the nodes. Our data indicate that it is feasible to alter the architecture of ornamental and crop plants by manipulating these genetically defined pathways.
Figures
Similar articles
-
Pedicel development in Arabidopsis thaliana: contribution of vascular positioning and the role of the BREVIPEDICELLUS and ERECTA genes.Dev Biol. 2005 Aug 15;284(2):451-63. doi: 10.1016/j.ydbio.2005.06.011. Dev Biol. 2005. PMID: 16038894
-
A novel Filamentous Flower mutant suppresses brevipedicellus developmental defects and modulates glucosinolate and auxin levels.PLoS One. 2017 May 11;12(5):e0177045. doi: 10.1371/journal.pone.0177045. eCollection 2017. PLoS One. 2017. PMID: 28493925 Free PMC article.
-
Regulation of floral patterning and organ identity by Arabidopsis ERECTA-family receptor kinase genes.J Exp Bot. 2013 Dec;64(17):5323-33. doi: 10.1093/jxb/ert270. Epub 2013 Sep 4. J Exp Bot. 2013. PMID: 24006425
-
Leaving the meristem behind: regulation of KNOX genes.Genome Biol. 2001;2(1):REVIEWS1002. doi: 10.1186/gb-2001-2-1-reviews1002. Epub 2001 Jan 9. Genome Biol. 2001. PMID: 11178282 Free PMC article. Review.
-
Epigenetic Mechanisms Are Critical for the Regulation of WUSCHEL Expression in Floral Meristems.Plant Physiol. 2015 Aug;168(4):1189-96. doi: 10.1104/pp.15.00230. Epub 2015 Mar 31. Plant Physiol. 2015. PMID: 25829464 Free PMC article. Review.
Cited by
-
Arabidopsis inflorescence architecture requires the activities of KNOX-BELL homeodomain heterodimers.Planta. 2006 Oct;224(5):1163-73. doi: 10.1007/s00425-006-0298-9. Epub 2006 Jun 2. Planta. 2006. PMID: 16741748
-
The Arabidopsis LATERAL ORGAN BOUNDARIES-domain gene ASYMMETRIC LEAVES2 functions in the repression of KNOX gene expression and in adaxial-abaxial patterning.Plant Cell. 2003 Oct;15(10):2241-52. doi: 10.1105/tpc.014969. Epub 2003 Sep 24. Plant Cell. 2003. PMID: 14508003 Free PMC article.
-
Translational fusions with the engrailed repressor domain efficiently convert plant transcription factors into dominant-negative functions.Nucleic Acids Res. 2002 Nov 1;30(21):4709-19. doi: 10.1093/nar/gkf591. Nucleic Acids Res. 2002. PMID: 12409462 Free PMC article.
-
Arabidopsis class I KNOTTED-like homeobox proteins act downstream in the IDA-HAE/HSL2 floral abscission signaling pathway.Plant Cell. 2011 Jul;23(7):2553-67. doi: 10.1105/tpc.111.084608. Epub 2011 Jul 8. Plant Cell. 2011. PMID: 21742991 Free PMC article.
-
Repression of BLADE-ON-PETIOLE genes by KNOX homeodomain protein BREVIPEDICELLUS is essential for differentiation of secondary xylem in Arabidopsis root.Planta. 2017 Jun;245(6):1079-1090. doi: 10.1007/s00425-017-2663-2. Epub 2017 Feb 15. Planta. 2017. PMID: 28204875
References
-
- Arabidopsis Genome Initiative (2000). Analysis of the genome sequence of the flowering plant Arabidopsis thaliana. Nature 408, 796–815. - PubMed
-
- Barton, M.K., and Poethig, R.S. (1993). Formation of the shoot apical meristem in Arabidopsis thaliana: An analysis of development in the wild type and in the shoot meristemless mutant. Development 119, 823–831.
-
- Becker, D., Kemper, E., Schell, J., and Masterson, R. (1992). New plant binary vectors with selectable markers located proximal to the left T-DNA border. Plant Mol. Biol. 20, 1195–1197. - PubMed
-
- Bowman, J.L. (2000). Axial patterning in leaves and other lateral organs. Curr. Opin. Genet. Dev. 10, 399–404. - PubMed
-
- Byrne, M.E., Barley, R., Curtis, M., Arroyo, J.M., Dunham, M., Hudson, A., and Martienssen, R.A. (2000). asymmetric leaves 1 mediates leaf patterning and stem cell function in Arabidopsis. Nature 408, 967–971. - PubMed
Publication types
MeSH terms
Substances
LinkOut - more resources
Full Text Sources
Other Literature Sources
Molecular Biology Databases
Research Materials
