. 2002 Mar;14(3):559-74.
doi: 10.1105/tpc.010410.

Expression profile matrix of Arabidopsis transcription factor genes suggests their putative functions in response to environmental stresses

Affiliations

Expression profile matrix of Arabidopsis transcription factor genes suggests their putative functions in response to environmental stresses

Wenqiong Chen et al. Plant Cell. 2002 Mar.

Abstract

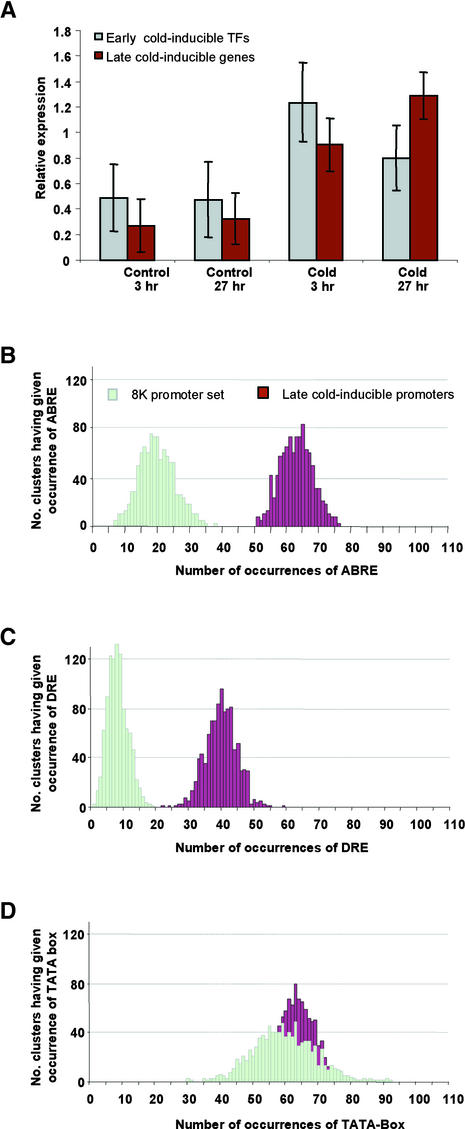
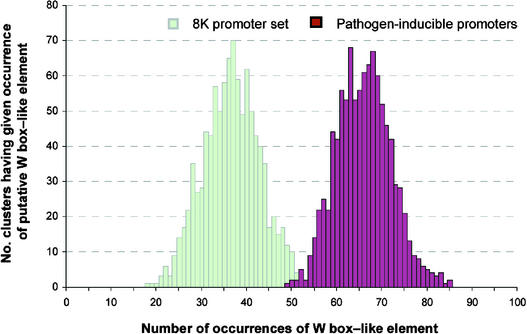
Numerous studies have shown that transcription factors are important in regulating plant responses to environmental stress. However, specific functions for most of the genes encoding transcription factors are unclear. In this study, we used mRNA profiles generated from microarray experiments to deduce the functions of genes encoding known and putative Arabidopsis transcription factors. The mRNA levels of 402 distinct transcription factor genes were examined at different developmental stages and under various stress conditions. Transcription factors potentially controlling downstream gene expression in stress signal transduction pathways were identified by observed activation and repression of the genes after certain stress treatments. The mRNA levels of a number of previously characterized transcription factor genes were changed significantly in connection with other regulatory pathways, suggesting their multifunctional nature. The expression of 74 transcription factor genes responsive to bacterial pathogen infection was reduced or abolished in mutants that have defects in salicylic acid, jasmonic acid, or ethylene signaling. This observation indicates that the regulation of these genes is mediated at least partly by these plant hormones and suggests that the transcription factor genes are involved in the regulation of additional downstream responses mediated by these hormones. Among the 43 transcription factor genes that are induced during senescence, 28 of them also are induced by stress treatment, suggesting extensive overlap responses to these stresses. Statistical analysis of the promoter regions of the genes responsive to cold stress indicated unambiguous enrichment of known conserved transcription factor binding sites for the responses. A highly conserved novel promoter motif was identified in genes responding to a broad set of pathogen infection treatments. This observation strongly suggests that the corresponding transcription factors play general and crucial roles in the coordinated regulation of these specific regulons. Although further validation is needed, these correlative results provide a vast amount of information that can guide hypothesis-driven research to elucidate the molecular mechanisms involved in transcriptional regulation and signaling networks in plants.


Figures

Figure 1.
Figure 1.
Expression Profiles of the Arabidopsis Transcription Factor Genes under Different Stress Conditions. The fold change values for each sample, relative to untreated control samples, were log2 transformed and subjected to complete linkage hierarchical clustering, as described in Methods. Expression values higher and lower than those of the control are shown in red and green, respectively. The higher the absolute value of a fold difference, the brighter the color. The yellow rectangles indicate five potentially interesting groups as discussed in the text. The arrows indicate four genes that belong to the Arabidopsis TGA subfamily. The numbered color bar at the top indicates the type of stress applied for each experiment: light gray indicates bacterial; medium gray indicates fungal; dark gray indicates oomycetic; light green indicates viral; dark green indicates abiotic; pink indicates chemical; and light orange indicates wounding (see supplemental data for details). The horizontal dendrogram (top) indicates the relationship among experiments across all of the genes included in the cluster analysis.
Figure 2.
Figure 2.
Expression of Transcription Factor Genes during Interactions with a Bacterial Pathogen in Mutant and Transgenic Plants That Are Deficient in Salicylic Acid, Jasmonic Acid, and Ethylene Signaling. Transcription factor genes that were induced more than twofold 30 hr after inoculation with P. syringae pv maculicola ES4326 in wild-type plants were selected. Hierarchical clustering was performed as described in Figure 1, except that the fold change was calculated as average difference in a P. syringae pv maculicola ES4326–infected mutant relative to the infected wild type. Vertical bars at left indicate the clusters of genes that are discussed in the text. Expression of the genes in group I was reduced in the mutant or transgenic plants that are deficient in salicylic acid signaling. Expression of the genes in group II was reduced in the mutants that are deficient in jasmonic acid and/or ethylene signaling. Expression of the genes in group III was reduced in all of the mutants and transgenic plants. Examples of genes in each group are indicated. wt, wild type.
Figure 3.
Figure 3.
Expression Patterns of the Transcription Factor Genes during Leaf Development. The average difference was log2 transformed, mean centered for each gene, and subjected to the self-organization map algorithm using a 5 × 4 two-dimensional matrix and 100,000 epochs. The mean expression patterns for 20 distinct gene clusters (blue lines) and the standard deviation for each mean expression level (red lines) are shown. The y axis indicates the relative expression for all of the genes in that cluster, and the x axis indicates the stages during leaf development, following the order of 2-week-old leaf,a 2-week-old leaf,b 5-week-old leaf,a 6.5-week-old leaf,b 8-week-old leaf,b and 11- week-old leafa (a, samples were collected in the afternoon; b, samples were collected in the morning) (see supplemental data for detailed information). The number of genes in each cluster is indicated at the top center of each cluster graph. The clusters for the genes that were expressed at higher levels at 8 and/or 11 weeks are indicated by yellow boxes. c, cluster.
Figure 4.
Figure 4.
Expression Profiles for the Arabidopsis Transcription Factor Genes in Different Organs and at Different Developmental Stages. Clustering was performed as described in Figure 1, except that the expression values, rather than fold changes, were used for cluster analysis. The color for each gene indicates its expression level relative to its mean across all of the experiments. Expression greater than mean level is represented by red, expression less than mean level is represented by green, and expression close to mean level is represented by black. Genes that are expressed preferentially in root, leaf, flower/silique, and senescent leaf/inflorescence are indicated. Genes that do not show detectable expression in any of the experiments are shown as a stretch of black across all experiments. The expression pattern for TINY is enlarged as indicated. Col, Columbia; d, day-old; Imm, immature; Inflo, inflorescence; Sil, silique; wk, week-old.
Figure 5.
Figure 5.
ABRE-like and DRE-like Elements Are Enriched among the Promoters for Late Cold Response Genes. (A) Expression of transcription factor genes and other genes that are induced by cold treatment. Transcription factor genes and other genes that are induced during 4°C cold treatment were selected based on self-organizing map analysis and hierarchical cluster analysis as described in Methods. The cluster shown contains transcription factor genes and the genes on the Arabidopsis GeneChip that are activated by cold treatment at either 3 hr (early) or 27 hr (late). The y axis indicates the relative expression for the genes in each cluster, with sd values indicated at the top of each bar. (B) to (D) Occurrences of the ABRE-like element (B), the DRE-like element (C), and the TATA box (D) among the bootstrapped sets of late cold response promoters (brown bars) were compared with those among the bootstrapped control promoter sets (light green bars). TFs, transcription factors.
Figure 6.
Figure 6.
A W Box–like Element Is Overrepresented among the Promoters of Genes in the Pathogen-Inducible Gene Cluster. The pathogen-inducible gene cluster was selected based on self-organizing map analysis and hierarchical clustering as described in Methods. Histograms were generated as described in Figure 5 for the control promoters of all of the genes on the Arabidopsis GeneChip (light green bars) and the promoters of all of the genes within the pathogen-inducible gene cluster (brown bars).

References

    1. Alonso, J.M., Hirayama, T., Roman, G., Nourizadeh, S., and Ecker, J.R. (1999). EIN2, a bifunctional transducer of ethylene and stress responses in Arabidopsis. Science 284, 2148–2152. - PubMed
    1. Altschul, S.F., Madden, T.L., Schaeffer, A.A., Zhang, J., Zhang, Z., Miller, W., and Lipman, D.J. (1997). Gapped BLAST and PSI-BLAST: A new generation of protein database search programs. Nucleic Acids Res. 25, 3389–3402. - PMC - PubMed
    1. Baima, S., Possenti, M., Matteucci, A., Wisman, E., Altamura, M.M., Ruberti, I., and Morelli, G. (2001). The Arabidopsis athb-8 hd-zip protein acts as a differentiation-promoting transcription factor of the vascular meristems. Plant Physiol. 126, 643–655. - PMC - PubMed
    1. Borden, K.L. (2000). RING domains: Master builders of molecular scaffolds? J. Mol. Biol. 295, 1103–1112. - PubMed
    1. Cao, H., Glazebrook, J., Clarke, J.D., Volko, S., and Dong, X. (1997). The Arabidopsis NPR1 gene that controls systemic acquired resistance encodes a novel protein containing ankyrin repeats. Cell 88, 57–63. - PubMed

Publication types

MeSH terms