Comparative Study
. 2002 Mar;14(3):641-54.
doi: 10.1105/tpc.010336.

In vivo analysis of the role of atTic20 in protein import into chloroplasts

Affiliations
Comparative Study

In vivo analysis of the role of atTic20 in protein import into chloroplasts

Xuejun Chen et al. Plant Cell. 2002 Mar.

Abstract

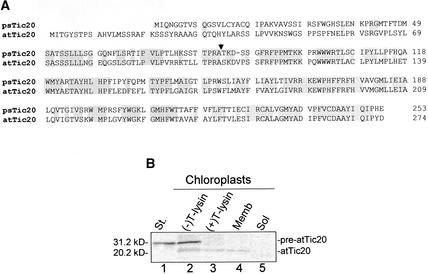
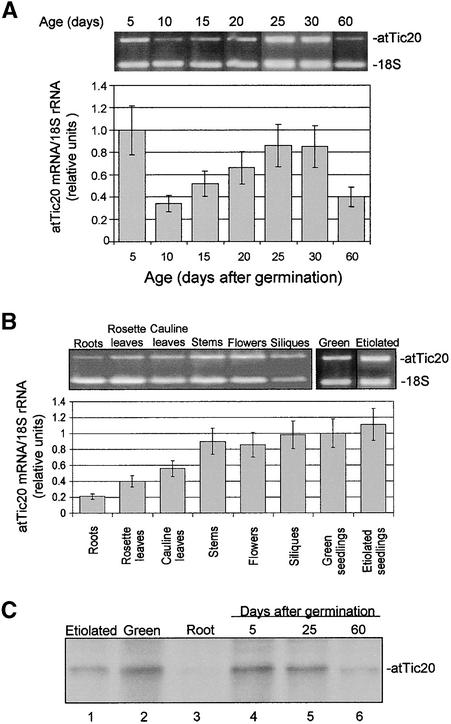
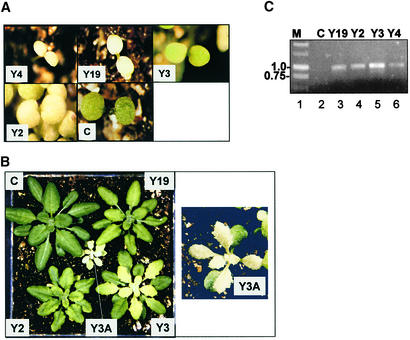
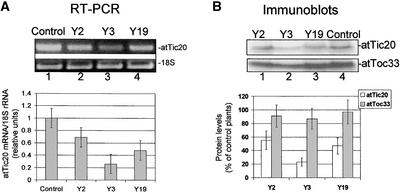
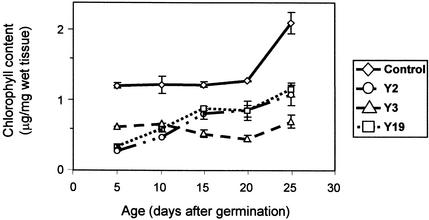
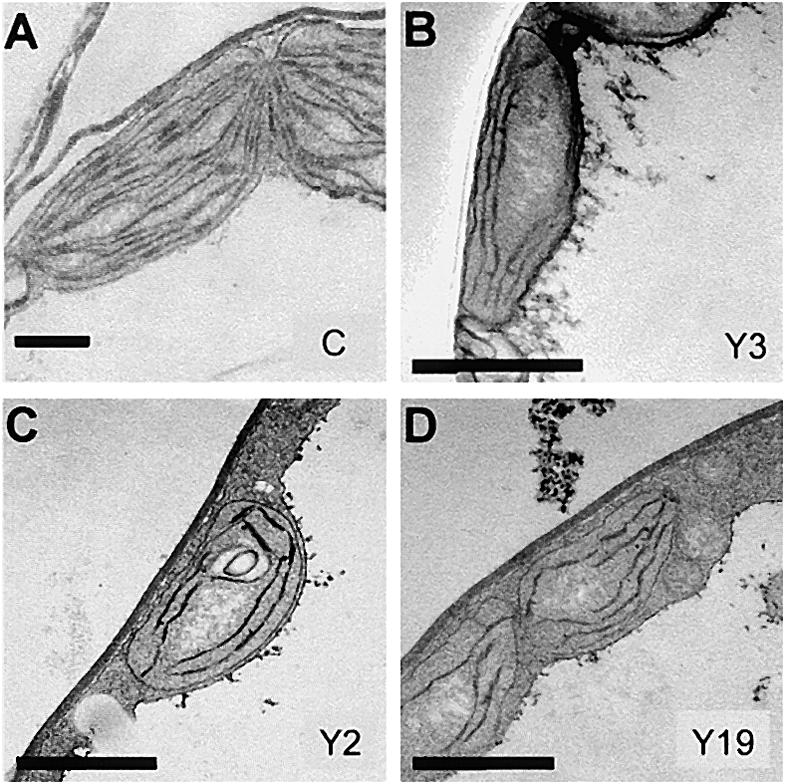
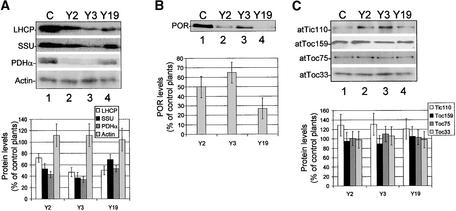
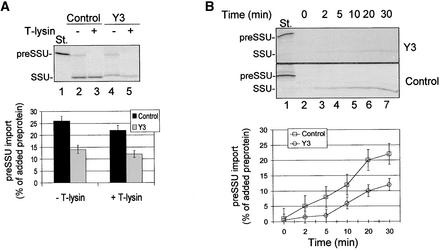
The import of nucleus-encoded preproteins into plastids requires the coordinated activities of membrane protein complexes that facilitate the translocation of polypeptides across the envelope double membrane. Tic20 was identified previously as a component of the import machinery of the inner envelope membrane by covalent cross-linking studies with trapped preprotein import intermediates. To investigate the role of Tic20 in preprotein import, we altered the expression of the Arabidopsis Tic20 ortholog (atTic20) by antisense expression. Several antisense lines exhibited pronounced chloroplast defects exemplified by pale leaves, reduced accumulation of plastid proteins, and significant growth defects. The severity of the phenotypes correlated directly with the reduction in levels of atTic20 expression. In vitro import studies with plastids isolated from control and antisense plants indicated that the antisense plastids are defective specifically in protein translocation across the inner envelope membrane. These data suggest that Tic20 functions as a component of the protein-conducting channel at the inner envelope membrane.


Figures

Figure 1.
Figure 1.
Comparison of atTic20 and psTic20. (A) Alignment of psTic20 and atTic20. Identical residues are indicated by shaded boxes. The position of the transit sequence cleavage site of psTic20 is indicated by the arrowhead. (B) Import of pre-atTic20 into isolated chloroplasts. In vitro–translated 35S-pre-atTic20 was incubated in a standard protein import reaction with chloroplasts (25 μg of chlorophyll) for 30 min at 26°C. After the import reaction, the chloroplasts were treated for 30 min on ice in the presence (+) or absence (−) of 100 μg/mL thermolysin (T-lysin). Thermolysin-treated chloroplasts were lysed and fractionated into membrane (Memb) and soluble (Sol) components. All samples were analyzed by SDS-PAGE on 15% (w/v) acrylamide gels and phosphorimaging. 35S-pre-atTic20 was imported into chloroplasts and processed to its mature form. The measured sizes of pre-atTic20 (31.2 kD) and mature atTic20 (20.2 kD) are indicated at left. Lane 1 (St.) contains 10% of the 35S-pre-atTic20 translation product added to each reaction.
Figure 2.
Figure 2.
Expression Pattern of atTic20. (A) Temporal expression pattern of atTic20 mRNA. Total RNA was extracted from wild-type Arabidopsis plants at the ages indicated. The relative atTic20 mRNA levels were determined by comparative RT-PCR using 18S rRNA as the control (see Methods). The levels of atTic20 mRNA are expressed as the ratio of the ethidium bromide stain intensity of the atTic20 and 18S rRNA PCR products. atTic20 expression was highest during periods of rapid growth and declined as plants matured. (B) Tissue distribution of atTic20 mRNA expression. Total RNA was extracted from the indicated tissues of 40-day-old light-grown or 5-day-old etiolated plants. The relative atTic20 mRNA level in each tissue was determined by comparative RT-PCR as described in (A). atTic20 mRNA was detected at varying levels in all tissues examined. (C) Distribution of the atTic20 protein. Total membrane fractions (75 μg of protein each) from etiolated, green, and root tissues or green tissue harvested at the times indicated were resolved by SDS-PAGE, transferred to nitrocellulose, and immunoblotted with anti-atTic20 IgG. atTic20 protein was detected in all tissues examined, with the highest levels found in young green tissues. Error bars in (A) and (B) indicate ±sd.
Figure 3.
Figure 3.
Phenotypes of atTic20 Antisense Plants. (A) Comparison of 5-day-old control (C), Y2, Y3, Y4, and Y19 antisense lines grown on soil. The Y4 and Y19 lines exhibit marked pale phenotypes at early stages of plant development, whereas the Y3 and Y2 lines are only slightly pale. (B) Comparison of 40-day-old control (C), Y2, Y3, and Y19 antisense lines grown on soil. A 40-day-old Y3 plant homozygous for the atTic20 antisense gene (Y3A) is shown in the center of the left panel and shown enlarged 2.5 times at right. The true leaves of Y2, Y3, and Y19 antisense plants exhibit a variety of pale phenotypes and moderate growth defects. Y3 homozygous plants (Y3A) exhibit a severe pale phenotype and growth defect. (C) Confirmation of antisense gene incorporation into the genome of lines exhibiting antisense phenotypes. Genomic DNA from the indicated antisense (Y19, Y2, Y3, andY4) and control (C) plants was extracted and subjected to PCR using primers p3300s and p3300a that are specific for regions of the pCAMBIA3300-1 vector flanking the atTic20 antisense gene. Lane 1 contains DNA molecular mass markers (M). The 1.0- and 0.75-kb markers are indicated at left.
Figure 4.
Figure 4.
Suppression of atTic20 mRNA and Protein Expression in Antisense Arabidopsis Plants. (A) atTic20 mRNA levels in antisense plants. Total RNA was extracted from the leaves of 30-day-old control or antisense (Y2, Y3, and Y19) plants. The relative amount of atTic20 mRNA in each RNA sample was determined by comparative RT-PCR using 18S rRNA as the internal control. The graph at bottom represents the average of four experiments. The gel at top shows an ethidium bromide–stained agarose gel from one representative experiment. The levels of atTic20 mRNA were reduced significantly in all three antisense lines. (B) atTic20 protein levels in antisense plants. Immunoblots of chloroplast envelope membranes (25 μg of protein each) from control and antisense (Y2, Y3, and Y19) plants with anti-atTic20 and anti-atToc33 IgGs. The levels of atTic20 and atToc33 in antisense samples are expressed as a percentage of the levels measured in samples from control plants. The gel at top shows one representative immunoblot of four used for the quantitative analysis. The immunoblots confirm that atTic20 expression is reduced in all three antisense lines, whereas atToc33 is not affected significantly. Error bars indicate ±sd.
Figure 5.
Figure 5.
Comparison of Chlorophyll Content in Antisense and Control Plants. Chlorophyll was extracted from the aboveground portions of control and antisense atTic20 (Y2, Y3, and Y19) plants at 5-day intervals with 80% acetone. Chlorophyll content was quantified by absorption at 652 nm by the method of Arnon (1949). Each data point represents the mean of four or more measurements. The chlorophyll content of all three antisense lines was reduced throughout development, consistent with their pale phenotypes. Error bars indicate ±sd.
Figure 6.
Figure 6.
Ultrastructure of Chloroplasts from atTic20 Antisense Plants. Control (A), Y3 (B), Y2 (C), and Y19 (D) antisense plants were grown on agar plates containing 1% Suc. Electron microscopic samples were prepared from the pale leaves of antisense plants and the corresponding green leaves of control plants of the same age. The antisense lines exhibited a decrease in thylakoid membrane development consistent with their pale phenotypes. Bars = 400 nm.
Figure 7.
Figure 7.
Accumulation of Nucleus-Encoded Plastid Proteins in Antisense Plants. Protein was extracted directly from total aboveground tissue of antisense and control (C) seedlings by boiling in SDS-PAGE sample buffer. Samples were resolved by SDS-PAGE, transferred to nitrocellulose membranes, and immunoblotted with antisera to the proteins indicated at left. The levels of the indicated proteins in antisense samples are expressed as a percentage of the levels of the corresponding protein measured in samples from control plants. The top section in each panel shows one representative immunoblot of the four used for the quantitative analysis. (A) Immunoblots of extracts (10 μg of protein) from 30-day-old light-grown seedlings. The levels of three plastid proteins, LHCP, SSU, and PDHα, were reduced in the antisense plants. The levels of the cytoplasmic marker, actin, were not reduced in the antisense lines. (B) Immunoblot of extracts (25 μg of protein) from 5-day-old etiolated seedlings with anti-POR serum. The accumulation of the major etioplast protein POR was reduced in atTic20 antisense plants. (C) Immunoblots of extracts (25 μg of protein) from 30-day-old light-grown seedlings with anti-atTic110, anti-atToc159, anti-atToc75, and anti-atToc33 sera. The levels of other Toc and Tic components were not reduced by atTic20 antisense expression. Error bars indicate ±sd.
Figure 8.
Figure 8.
Import of preSSU into Isolated Chloroplasts of Antisense Plants. Chloroplasts were prepared from 2- to 4-week-old control or Y3 seedlings grown on agar plates containing 1% Suc. (A) Import of preSSU in control and antisense plants. In vitro–translated 35S-preSSU was incubated with chloroplasts (50 μg of chlorophyll) from control or Y3 antisense plants in a standard protein import reaction for 30 min. The samples were divided in half and treated with 100 μg/mL thermolysin (+ T-lysin) or buffer (− T-lysin) on ice for 30 min. The chloroplasts were reisolated through 40% Percoll silica gel and analyzed directly by SDS-PAGE and phosphorimaging. One-tenth of the 35S-preSSU in vitro translation product (St.) added to each reaction is shown in lane 1. The level of preSSU import was reduced in Y3 antisense chloroplasts. (B) Time course of 35S-preSSU import into isolated chloroplasts from control or Y3 antisense plants. Import was performed as in (A). Samples corresponding to 25 μg of chlorophyll were collected at the times indicated, treated with 100 μg/mL thermolysin on ice for 30 min, reisolated through 40% Percoll silica gel, and analyzed directly by SDS-PAGE and phosphorimaging. One-tenth of the 35S-preSSU in vitro translation product (St.) added to each reaction is shown in lane 1. The positions of precursor (preSSU) and mature (SSU) proteins are indicated at left. The chloroplasts from Y3 antisense plants exhibited a slower rate of preSSU import than control plants. The gel at the top of each panel shows one representative fluorograph of the four used for the quantitative analysis. Error bars indicate ±sd.
Figure 9.
Figure 9.
Titration of the Formation of a preSSU Early Import Intermediate in Chloroplasts from Antisense Plants. Chloroplasts were prepared from 2- to 4-week-old control or Y3 seedlings grown on agar plates containing 1% Suc. Isolated chloroplasts were depleted of endogenous ATP by incubating at 26°C in the dark for 10 min. Energy-depleted chloroplasts (50 μg of chlorophyll) were incubated with 0.1 mM ATP and varying concentrations of 35S-preSSU as indicated at 26°C in the dark for 10 min. The chloroplasts were reisolated through 40% Percoll silica gel and analyzed directly by SDS-PAGE and phosphorimaging. Ten picomoles of 35S-preSSU is shown in lane 9 (St.). The gel at top shows one representative fluorograph of the four used for the quantitative analysis. The association of preSSU with the Toc complex was not altered in the Y3 antisense plants. Error bars indicate ±sd.
Figure 10.
Figure 10.
Translocation of preSSU across the Inner Envelope Membrane of Chloroplasts from Antisense Plants. Chloroplasts were prepared from 2- to 4-week-old control or Y3 seedlings grown on agar plates containing 1% Suc. Isolated chloroplasts were depleted of endogenous ATP by incubating at 26°C in the dark for 10 min. The chloroplasts were incubated with 0.1 mM ATP and 200 nM 35S-preSSU at 26°C in the dark for 10 min. The chloroplasts were reisolated through 40% Percoll silica gel, resuspended in buffer containing 2 mM ATP, and incubated for 15 min at 26°C in the light. The chloroplasts were collected by centrifugation and analyzed directly by SDS-PAGE and phosphorimaging. The positions of precursor (preSSU) and mature (SSU) proteins are indicated at right. The amount of 35S-preSSU bound to chloroplasts during the first incubation in the presence of 0.1 mM ATP is shown by the black bars. The amount of mature 35S-SSU associated with chloroplasts after the subsequent incubation in the presence of 2 mM ATP is shown by the gray bars. The gels at top show representative fluorographs of the four used for the quantitative analysis. The import of preSSU into chloroplasts of Y3 antisense plants was inhibited selectively at the stage of translocation across the inner envelope membrane. IM, inner membrane; OM, outer membrane. Error bars indicate ±sd.

Similar articles

Cited by

References

    1. Akita, M., Nielsen, E., and Keegstra, K. (1997). Identification of protein transport complexes in the chloroplastic envelope membranes via chemical cross-linking. J. Cell Biol. 136, 983–994. - PMC - PubMed
    1. Arnon, D.I. (1949). Copper enzymes in isolated chloroplasts: Polyphenooxidase in Beta vulgaris. Plant Physiol. 24, 1–15. - PMC - PubMed
    1. Aronsson, H., Sohrt, K., and Soll, J. (2000). NADPH:protochlorophyllide oxidoreductase uses the general import route into chloroplasts. Biol. Chem. 381, 1263–1267. - PubMed
    1. Bauer, J., Chen, K., Hiltbrunner, A., Wehrli, E., Eugster, M., Schnell, D., and Kessler, F. (2000. a). The major protein import receptor of plastids is essential for chloroplast biogenesis. Nature 403, 203–207. - PubMed
    1. Bauer, M.F., Hofmann, S., Neupert, W., and Brunner, M. (2000. b). Protein translocation into mitochondria: The role of TIM complexes. Trends Cell Biol. 10, 25–31. - PubMed

Publication types

MeSH terms