

Evolutionary analysis by whole-genome comparisons
- PMID: 11914358
- PMCID: PMC134949
- DOI: 10.1128/JB.184.8.2260-2272.2002
Evolutionary analysis by whole-genome comparisons
Abstract
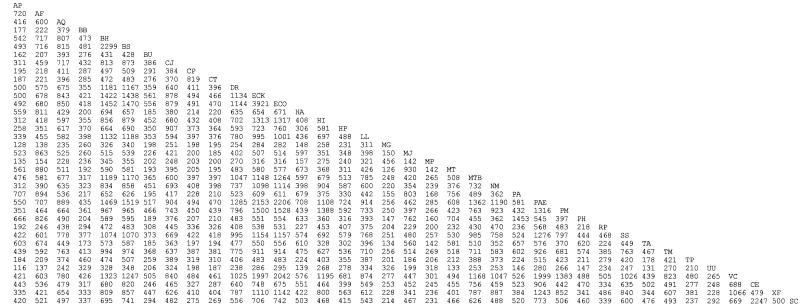
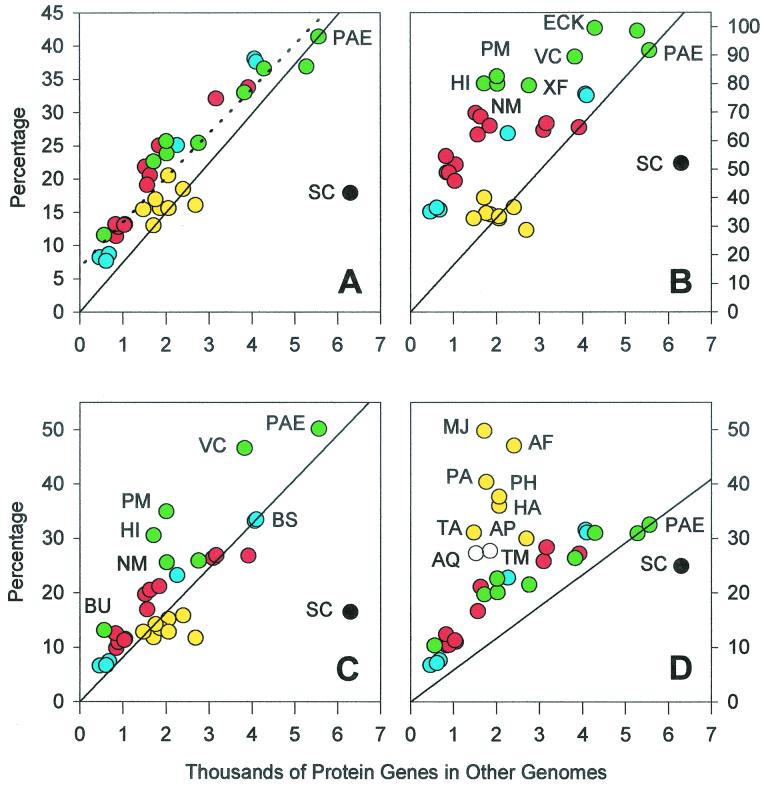
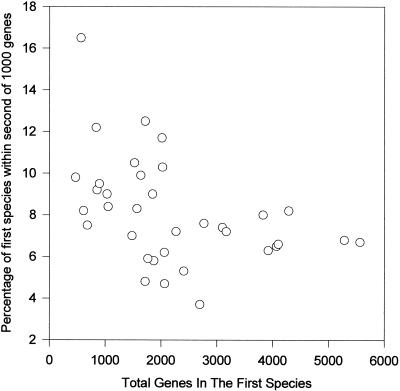
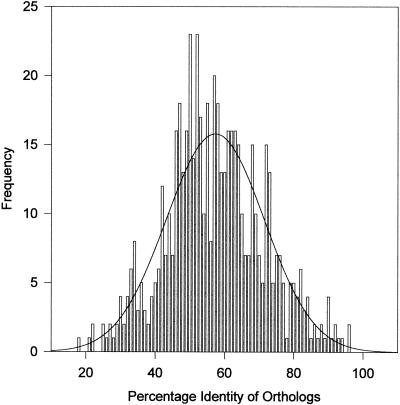
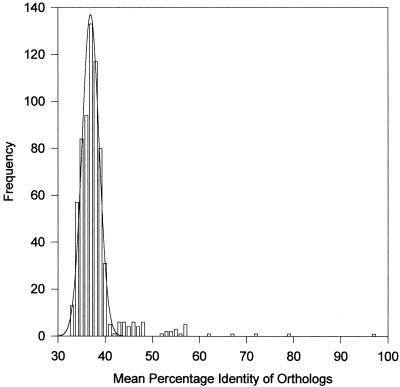
A total of 37 complete genome sequences of bacteria, archaea, and eukaryotes were compared. The percentage of orthologous genes of each species contained within any of the other 36 genomes was established. In addition, the mean identity of the orthologs was calculated. Several conclusions result: (i) a greater absolute number of orthologs of a given species is found in larger species than in smaller ones; (ii) a greater percentage of the orthologous genes of smaller genomes is contained in other species than is the case for larger genomes, which corresponds to a larger proportion of essential genes; (iii) before species can be specifically related to one another in terms of gene content, it is first necessary to correct for the size of the genome; (iv) eukaryotes have a significantly smaller percentage of bacterial orthologs after correction for genome size, which is consistent with their placement in a separate domain; (v) the archaebacteria are specifically related to one another but are not significantly different in gene content from the bacteria as a whole; (vi) determination of the mean identity of all orthologs (involving hundreds of gene comparisons per genome pair) reduces the impact of errors in misidentification of orthologs and to misalignments, and thus it is far more reliable than single gene comparisons; (vii) however, there is a maximum amount of change in protein sequences of 37% mean identity, which limits the use of percentage sequence identity to the lower taxa, a result which should also be true for single gene comparisons of both proteins and rRNA; (viii) most of the species that appear to be specifically related based upon gene content also appear to be specifically related based upon the mean identity of orthologs; (ix) the genes of a majority of species considered in this study have diverged too much to allow the construction of all-encompassing evolutionary trees. However, we have shown that eight species of gram-negative bacteria, six species of gram-positive bacteria, and eight species of archaebacteria are specifically related in terms of gene content, mean identity of orthologs, or both.
Figures


References
-
- Ainscough, R., et al. 1998. Genome sequence of the nematode C. elegans: a platform for investigating biology. Science 282:2012-2018. - PubMed
-
- Altschul, S. F., W. Gish, W. Miller, E. W. Myers, and D. J. Lipman. 1990. Basic local alignment search tool. J. Mol. Biol. 215:403-410. - PubMed
-
- Andersson, S. G. E., A. Zomorodipour, J. O. Andersson, T. Sicheritz-Ponten, U. C. M. Alsmark, R. M. Podowski, A. K. Naslund, A. S. Eriksson, H. H. Winkler, and C. G. Kurland. 1998. The genome sequence of Rickettsia prowazekii and the origin of mitochondria. Nature 396:133-140. - PubMed
-
- Bansal, A. K. 1999. An automated comparative analysis of 17 complete microbial genomes. Bioinformatics 15:900-908. - PubMed
-
- Bansal, A. K., P. Bork, and P. J. Stuckey. 1998. Automated pair-wise comparisons of microbial genomes. Math. Model. Sci. Comput. 9:1-23.
Publication types
MeSH terms
Substances
Grants and funding
LinkOut - more resources
Full Text Sources
Other Literature Sources
