

Profiles of airborne fungi in buildings and outdoor environments in the United States
- PMID: 11916692
- PMCID: PMC123871
- DOI: 10.1128/AEM.68.4.1743-1753.2002
Profiles of airborne fungi in buildings and outdoor environments in the United States
Abstract
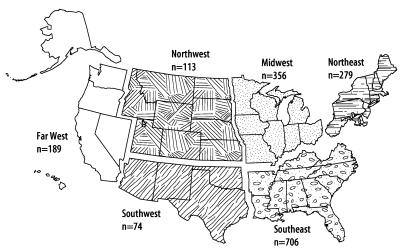
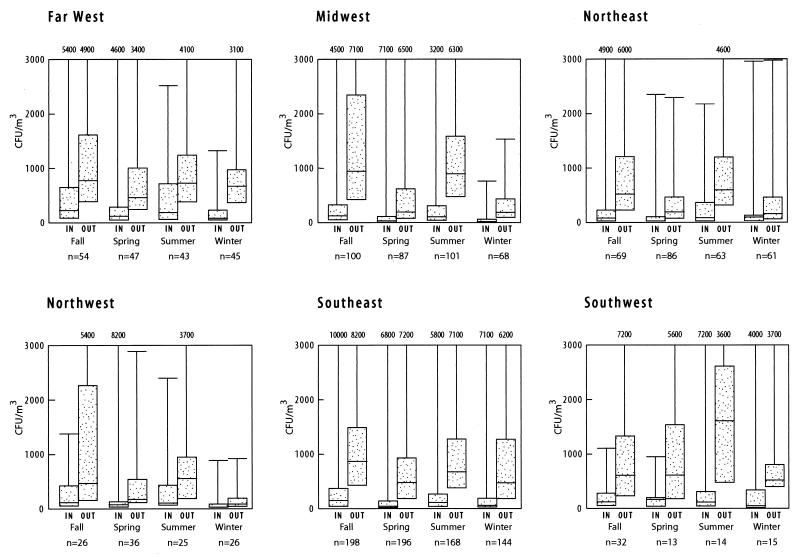
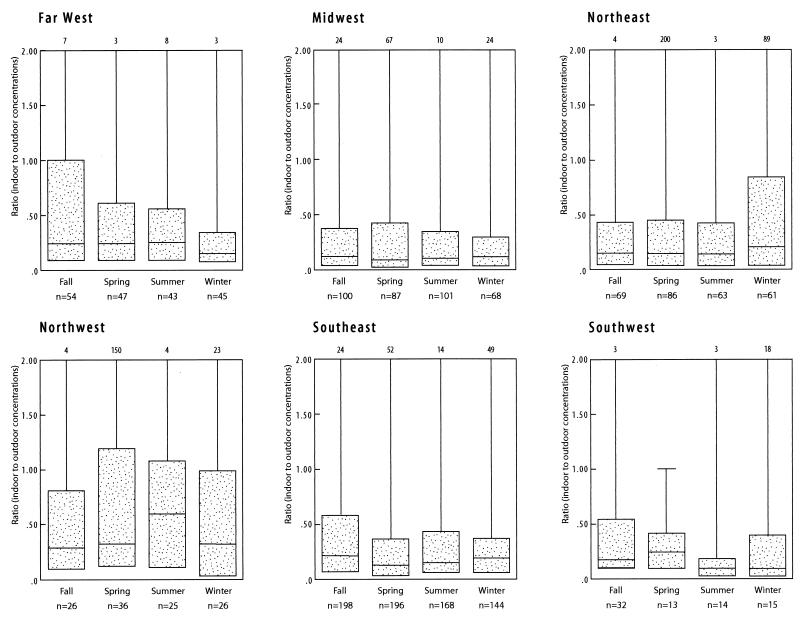
We examined 12,026 fungal air samples (9,619 indoor samples and 2,407 outdoor samples) from 1,717 buildings located across the United States; these samples were collected during indoor air quality investigations performed from 1996 to 1998. For all buildings, both indoor and outdoor air samples were collected with an Andersen N6 sampler. The culturable airborne fungal concentrations in indoor air were lower than those in outdoor air. The fungal levels were highest in the fall and summer and lowest in the winter and spring. Geographically, the highest fungal levels were found in the Southwest, Far West, and Southeast. The most common culturable airborne fungi, both indoors and outdoors and in all seasons and regions, were Cladosporium, Penicillium, nonsporulating fungi, and Aspergillus. Stachybotrys chartarum was identified in the indoor air in 6% of the buildings studied and in the outdoor air of 1% of the buildings studied. This study provides industrial hygienists, allergists, and other public health practitioners with comparative information on common culturable airborne fungi in the United States. This is the largest study of airborne indoor and outdoor fungal species and concentrations conducted with a standardized protocol to date.
Figures
References
-
- Beaumont, F., H. F. Kauffman, H. J. Sluiter, and K. de Vries. 1984. A volumetric-aerobiologic study of seasonal fungus prevalence inside and outside dwellings of asthmatic patients living in northeast Netherlands. Ann. Allergy 53:486-492. - PubMed
-
- Bush, R. K., and J. M. Portnoy. 2001. The role and abatement of fungal allergens in allergic diseases. J. Allergy Clin. Immunol. 107:430-440. - PubMed
-
- Centers for Disease Control and Prevention. 1999. Report of the CDC Working Group on Pulmonary Hemorrhage/Hemosiderosis. Centers for Disease Control and Prevention, Atlanta, Ga.
-
- Centers for Disease Control and Prevention. 2000. Update: pulmonary hemorrhage/hemosiderosis among infants—Cleveland, Ohio, 1993-1996. Morb. Mortal. Wkly. Rep. 49:180-184. - PubMed
MeSH terms
LinkOut - more resources
Full Text Sources
Medical
