. 2002 Apr 2;99(7):4674-9.
doi: 10.1073/pnas.072075399. Epub 2002 Mar 26.

Desensitization of mu-opioid receptor-evoked potassium currents: initiation at the receptor, expression at the effector

Affiliations

Desensitization of mu-opioid receptor-evoked potassium currents: initiation at the receptor, expression at the effector

Christophe Blanchet et al. Proc Natl Acad Sci U S A. .

Abstract

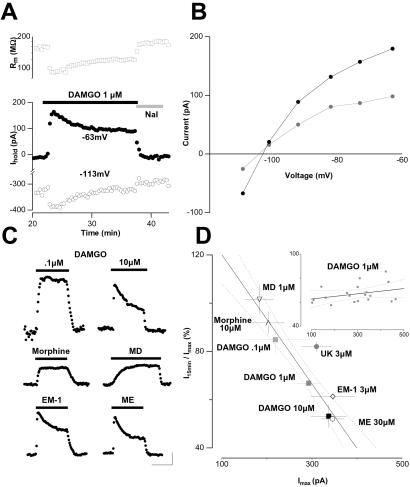
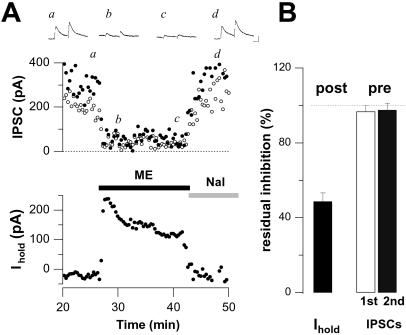
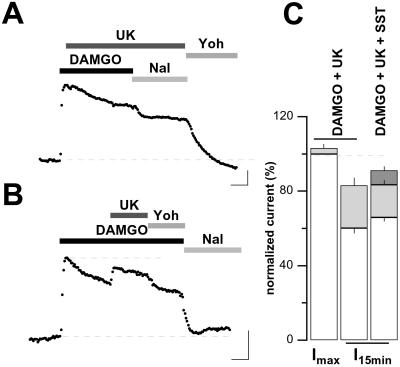
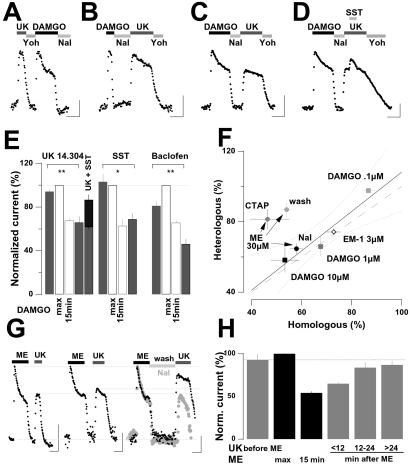
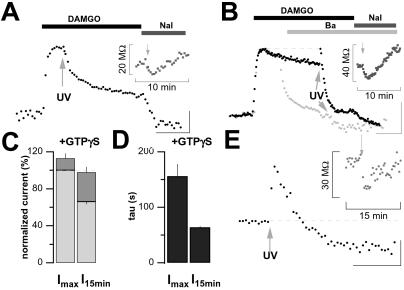
Many G protein-coupled receptor-mediated responses desensitize within minutes. Sustained stimulation of mu-opioid receptors (MORs), which primarily signal through G(i/o) proteins, leads to activation and subsequent desensitization of G protein-coupled inwardly rectifying potassium (GIRK) currents. We observed that in neurons of the locus coeruleus, which express among the highest levels of MORs in the brain, the degree of desensitization depended on the intensity of receptor stimulation, indicating that the process is initiated at the receptor. Interestingly, while GIRK-mediated postsynaptic inhibition substantially desensitized within 15 min, presynaptic inhibition of afferent transmission, which involves other effector systems, remained constant, suggesting that the postsynaptic desensitization we observed is expressed at the effector. We show that desensitized GIRK currents can gradually be reactivated by additional G protein signals of increasing intensity and present evidence that desensitization is a G protein-mediated process. Finally, desensitization of MOR-induced GIRK currents had heterologous effects on responses mediated by other G protein-coupled receptors converging onto the same population of GIRK channels. Taken together, our results provide evidence for a form of desensitization mediated by a slowly developing G protein-dependent pathway, initiated at the MORs and leading to competitive inhibition of GIRK channel activation. This implies that MORs exert a bidirectional action on GIRK channels.


Figures

Figure 1
Figure 1
Desensitization of the MOR-induced GIRK currents is associated with decreased GIRK conductance, and depends on the intensity of receptor stimulation. (A) Example of a MOR-induced response in an electrotonically uncoupled LC neuron (see Methods). Application of the selective MOR-agonist DAMGO (1 μM) for 15 min evoked an outward current at −63 mV and an inward current at −113 mV (Lower). This current desensitizes substantially within 15 min at both holding potentials. Activation and desensitization are associated with a decrease and subsequent partial recovery of the membrane resistance (Rm; Upper) (B) IV relationships of maximal (Imax) and desensitized (I15min) DAMGO-elicited currents of the LC neuron shown in A. Both IV curves reverse at the same potential, which is close to the calculated EK (−106 mV) and show inward rectification. (C) Examples of responses elicited by the application of different MOR-agonists at various concentrations for 15 min [25 min for methadone (MD)]. (Scale bars, 100 pA and 10 min; Vh = −73 mV.) (D) Mean (±SE) normalized residual response (I15min/Imax) after application for 15 min of various MOR agonists and UK14,304 as a function of respective mean (±SE) maximal responses (Imax, n = 5–19). Inset shows I15min/Imax as a function of respective Imax for each cell stimulated with 1 μM DAMGO. Regression line (r2 = 0.95 for D, UK values excluded, r2 = 0.1 for Inset) and 95% confidence intervals (dotted lines) were calculated.
Figure 2
Figure 2
MOR-mediated presynaptic inhibition does not desensitize. (A) ME-induced presynaptic inhibition of GABAA-mediated IPSCs remained constant while the concomitant postsynaptic GIRK response substantially desensitized. GABAA-mediated IPSCs were boosted with 5 mM extracellular calcium and paired pulse facilitation to avoid complete inhibition. AMPA receptor, NMDA receptor, and DORs were blocked by 2 mM kynurenic acid and 1 μM ICI174,864 throughout the experiment (Vh = −53 mV). (Insets) Averaged traces of paired evoked IPSCs at referred time (a, b, c, and d). (Scale bars, 100 pA and 20 ms.) (B) Bar graph representation of mean (±SE) normalized residual post- (Left) and presynaptic (Right) effects of 30 μM ME after 15 min application (n = 6). Residual GIRK response was normalized as I15min/Imax, whereas presynaptic inhibition was normalized as inhibition after 15 min per initial inhibition. Responses from three consecutive measures were binned.
Figure 3
Figure 3
Desensitized DAMGO-elicited GIRK currents may be reactivated. (A) Stimulating α2ARs at the peak amplitude of the DAMGO-mediated response did not activate any additional GIRK current, indicating that both receptor systems share the same population of GIRK channels. (B) Stimulating α2ARs after desensitization of the DAMGO-mediated response partially restored the initial GIRK current amplitude. (Scale bars in A and B, 100 pA and 5 min; Vh = −73 mV.) (C) Bar graph representation of mean (±SE) normalized current amplitudes evoked by α2ARs stimulation (light gray bars) or SST (dark gray bar) stacked on bars representing MOR-elicited responses (empty bars) at the peak or in the desensitized state. Note that addition of SST onto DAMGO plus UK further increases the reactivation of the desensitized GIRK currents. Responses are expressed as percent of the peak DAMGO-elicited response in the same cell (n = 4 for each condition). UK, 3 μM; Yoh, 10 μM; DAMGO, 1 μM; Nal, 1 μM.
Figure 4
Figure 4
Heterologous effects of MOR-induced desensitization. (A) Example of responses elicited successively by UK and DAMGO. Stimulation of α2ARs triggers a large outward current reversed by Yoh. Subsequent stimulation of MORs triggers an outward current of similar amplitude that desensitizes substantially within 15 min. (B) The application of the above agonists in the reversed order also elicited outward currents of similar amplitude, provided that DAMGO was applied only briefly. (C) However, if DAMGO is applied for 15 min and Nal used to reverse the response after desensitization occurred, subsequent application of UK elicited an outward current with a maximal amplitude similar to the preceding MOR-induced desensitized response. (D) Same as in C, except that addition of 3 μM SST onto the UK-induced response partially reactivated this heterologously desensitized response. (AD) (Concentrations: DAMGO 1 μM, UK 3 μM, Nal 1 μM, Yoh 10 μM; scale bars, 100 pA and 10 min; Vh = −73 mV.) (E) Bar graph representation of mean (±SE) normalized responses evoked by 3 μM UK (n = 13), 3 μM somatostatin (SST; n = 3), or 100 μM Baclofen (GABAB agonist; n = 5) before 1 μM DAMGO for 15 min or conversely. The fifth bar from the left represents the responses to UK plus SST (n = 4), reflecting partial reactivation of heterologous desensitization. Responses are expressed as percent of the peak DAMGO-elicited response in the same cell. *, P < 0.05; **, P < 0.01. (F) Mean (±SE) normalized heterologously desensitized 3 μM UK-elicited response (ImaxUK/ImaxMORagonist) as a function of respective mean (±SE) normalized homologously desensitized responses (I15min/Imax) after 15 min applications of various MOR agonists followed by Nal (n = 3–13). Regression line (r2 = 0.91), 95% confidence intervals (dotted lines), and line of identity are superimposed (dashed line). The ME data, where the agonist was washed from the slice (ME 30 μM wash, also see below) or antagonized with CTAP, were not included for the calculation of the regression. (G) Representative records of currents evoked by ME (30 μM, 15 min) and subsequent UK (3 μM) applications separated by increasing duration of ME washout (from left to right: 5, 12, and 30 min). The right trace is scaled and superimposed onto a recording (light gray) where the MOR-induced currents were reversed by 30 min of Nal (1 μM) application. (Scale bars, 100 pA and 10 min; Vh = −73 mV.) (H) Bar graph representation of mean (±SE) normalized responses evoked by 3 μM UK (n = 3) before 30 μM ME and after increasing ME washout duration (n = 3–4). Responses are expressed as percent of the peak ME-elicited response in the same cell.
Figure 5
Figure 5
Photo release of GTPγS completely reactivates desensitized GIRK currents, and subsequently enhances desensitization. (A) Flash photolysis of caged-GTPγS (100 ms, arrow) at the peak amplitude of the DAMGO-mediated response did not activate any additional GIRK current, indicating that 1 μM DAMGO was sufficient to trigger the activation of all cellular GIRK channels. Note that the desensitization is apparently enhanced in the presence of GTPγS. (Inset) Decrease and subsequent slowly increase of membrane resistance (Rm) after GTPγS photolysis (arrow), indicating channel opening and subsequent closure. (B) Uncaging GTPγS (arrow, UV: 100 ms) after desensitization of the DAMGO-mediated response transiently restored the initial maximal GIRK current amplitude, indicating that GIRK channels can be fully reactivated from the desensitized state by a strong G protein-mediated signal. Again, the subsequent desensitization was increased. (Inset) Rm as in A. Superimposed is the scaled response of another cell (light gray) to the same protocol, except that 1 mM Barium (Ba) was added 5 min after the DAMGO application. Note that uncaged GTPγS triggered a small inward current in these conditions, equal in size to the small shift in baseline observed in A and B. (Scale bars, 100 pA and 5 min; Vh = −73 mV.) (C) Bar graph representation of mean (±SE) normalized outward current amplitudes evoked GTPγS photo release (dark gray bars) stacked on bars representing MOR-elicited responses (light gray bars) at the peak (Imax) or in the desensitized state (I15min). Responses are expressed as percent of the peak DAMGO-elicited response in the same cell. (D) Bar graph representation of mean (±SE) time constant of the exponential desensitization induced by GTPγS photo release at the peak (Imax) or in the desensitized state (I15min). (C and D) n = 4 for each condition. (E) Flash photolysis of caged-GTPγS (100 ms, arrow) in the absence of any agonist application triggered an outward current that desensitized within minutes. It also triggered a small inward current as observed above. (Scale bars, 50 pA and 5 min; Vh = −73 mV.) (Inset) Concomitant decrease and subsequent recovery of the cell membrane resistance.

References

    1. Matthes H W, Maldonado R, Simonin F, Valverde O, Slowe S, Kitchen I, Befort K, Dierich A, Le Meur M, Dolle P, et al. Nature (London) 1996;383:819–823. - PubMed
    1. Reuveny E, Slesinger P A, Inglese J, Morales J M, Iniguez-Lluhi J A, Lefkowitz R J, Bourne H R, Jan Y N, Jan L Y. Nature (London) 1994;370:143–146. - PubMed
    1. Huang C L, Slesinger P A, Casey P J, Jan Y N, Jan L Y. Neuron. 1995;15:1133–1143. - PubMed
    1. Williams J T, North R A, Tokimasa T. J Neurosci. 1988;8:4299–4306. - PMC - PubMed
    1. Miyake M, Christie M J, North R A. Proc Natl Acad Sci USA. 1989;86:3419–3422. - PMC - PubMed

Publication types

MeSH terms

Substances