. 2002 Apr 1;22(7):2443-50.
doi: 10.1523/JNEUROSCI.22-07-02443.2002.

Synaptically released acetylcholine evokes Ca2+ elevations in astrocytes in hippocampal slices

Affiliations

Synaptically released acetylcholine evokes Ca2+ elevations in astrocytes in hippocampal slices

Alfonso Araque et al. J Neurosci. .

Abstract

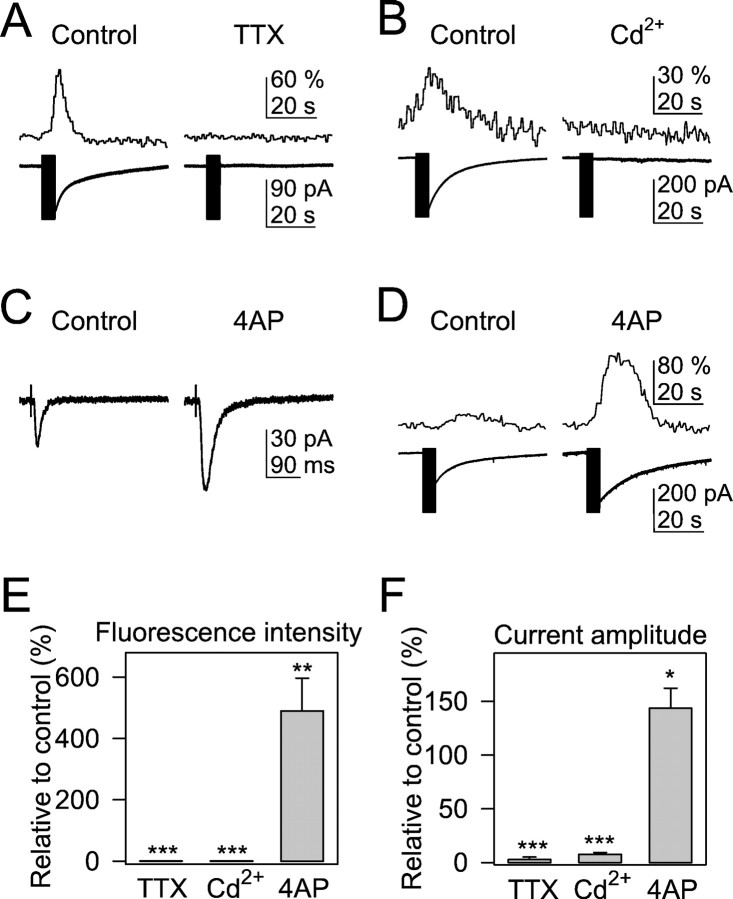
Recent results have demonstrated the existence of bidirectional communication between glial cells and neurons. We investigated in brain slices whether rat hippocampal astrocytes respond to acetylcholine synaptically released by an extrinsic pathway. We stimulated the stratum oriens/alveus, which contains cholinergic afferents from the septum and diagonal band of Broca, and recorded whole-cell membrane currents and intracellular Ca2+ levels of astrocytes located in the hippocampal stratum oriens. Nerve-fiber stimulation evoked a long-lasting inward current and increased the Ca2+ levels in astrocytes. Both astrocytic responses were abolished by tetrodotoxin or Cd2+ and were increased by 4-aminopyridine, indicating that the responses were attributable to synaptically released neurotransmitter. The inward current was inhibited by glutamate transporter antagonists, indicating that it was attributable to the electrogenic glutamate transporter activity. The synaptically evoked intracellular Ca2+ elevations were not affected by glutamate receptor antagonists but were abolished by atropine, indicating that they were mediated by muscarinic cholinergic receptors. Thapsigargin prevented the Ca2+ elevation but did not modify the inward current, indicating that the Ca2+ signal was attributable to intracellular Ca2+ mobilization. These results indicate that hippocampal astrocytes respond to acetylcholine released by synaptic terminals. The synaptically released acetylcholine acts on muscarinic receptors, mobilizing Ca2+ from the intracellular stores. Different regions in the recorded astrocytes showed independent stimulus-induced Ca2+ variations, suggesting the existence of subcellular domains in the astrocytic responses evoked by the synaptic cholinergic activity. Therefore, our results show the existence of cholinergic neuron-astrocyte signaling and suggest that astrocytes are a target of axonal inputs from different brain areas.


Figures

Fig. 1.
Fig. 1.
Morphological, immunocytochemical, and electrophysiological identification of astrocytes in the hippocampal stratum oriens is shown. A, Schematic drawing of the experimental arrangement showing the position of the stimulating (right) and recording (left) electrodes in the hippocampal slice preparation. B, Infrared differential interference contrast image showing the hippocampal pyramidal layer (bottom) and the recorded astrocyte (top) (note the recording pipette on the right side of the astrocyte). The fluorescence intensity was collected by the photomultiplier tube from the window depicted by the boxaround the astrocyte. C, Fluorescence image of the GFAP-stained CA1 hippocampus. D, E, Fluorescence images of GFAP-stained cells and a fluo-3-filled cell, respectively, obtained by laser-scanning confocal microscopy constructed from a stack of 15 successive images (1.5 μm deep). F, Combination of the images shown in D and E, showing that the fluo-3-filled cell was GFAP-positive. Arrows inD–F indicate some dual-labeled processes.G, Current-clamp recordings of the astrocytic membrane potential variations evoked by hyperpolarizing and depolarizing current pulses. H, Whole-cell currents evoked by hyperpolarizing and depolarizing voltage pulses. I, Current–voltage relationship of the steady-state membrane currents.S.O., Stratum oriens; S.P., stratum pyramidale; S.R., stratum radiatum. Scale bars:B, 15 μm, C, 75 μm,D–F, 8 μm.
Fig. 2.
Fig. 2.
Astrocytic responses evoked by ionophoretically applied ACh and nerve-fiber stimulation are shown. A, Intracellular Ca2+ levels estimated from the fluorescence intensity recorded from a single astrocyte filled with the Ca2+ indicator fluo-3. ACh, ionophoretically delivered from a micropipette (0.5 m, 5 sec; bottom line), increased the astrocytic Ca2+ levels in control conditions (left trace). In the presence of atropine, ionophoretic application of ACh did not modify the Ca2+ levels (right trace).B, Representative astrocytic Ca2+levels (top traces) and whole-cell membrane currents (bottom traces) elicited by nerve-fiber stimulation (30 Hz, 5 sec; as in all other figures). Three consecutive responses were evoked at 0.013 sec−1. The vertical black columns on the current traces correspond to the stimulus artifact (as in all other figures). C, Averaged responses of the traces shown in B. D, E, Dependence of the maximum current amplitude (solid circles) and Ca2+ increase (open circles) on the stimulus frequency and duration, respectively. Values are relative to the responses evoked by a stimulus at 30 Hz for 5 sec (dotted lines). Each point represents mean values from at least four astrocytes. F, In 15% of the recorded astrocytes, repetitive nerve-fiber stimulation (dotted line) evoked intracellular Ca2+elevations that were followed by intracellular Ca2+oscillations that persisted for several seconds after cessation of the stimulus.
Fig. 3.
Fig. 3.
Astrocytic responses are evoked by synaptically released neurotransmitter. A, B, Astrocytic Ca2+ levels (top traces) and whole-cell membrane currents (bottom traces) evoked by nerve-fiber stimulation in control conditions and in the presence of 1 μm TTX and 100 μm Cd2+, respectively. C, Averaged (n = 15) EPSCs evoked by Schaffer collateral–commissural stimulation and recorded from CA1 pyramidal neurons in controls and in the presence of 100 μm 4-AP. D, Astrocytic Ca2+ levels (top traces) and whole-cell membrane currents (bottom traces) evoked by nerve-fiber stimulation in control conditions and after superfusion with 100 μm 4-AP. E, F, Relative changes from control recordings of the fluorescence intensity and membrane current amplitudes, respectively, evoked by nerve-fiber stimulation in the presence of 1 μm TTX (n = 4), 100 μmCd2+ (n = 6), and 100 μm 4-AP (n = 14). Significant differences were established by the Student t test at *p < 0.05, **p < 0.01, and ***p < 0.001.
Fig. 4.
Fig. 4.
Participation of synaptically released glutamate in the astrocytic responses. A, B, Astrocytic Ca2+ levels (top traces) and whole-cell membrane currents (bottom traces) evoked by nerve-fiber stimulation in control conditions and in the presence of 0.3 mm t-PDC plus 1 mm DHK and 20 μm CNQX plus 50 μm AP-5, respectively. C, D, Relative changes from control recordings of the fluorescence intensity and membrane current amplitudes, respectively, evoked by nerve-fiber stimulation in the presence of t-PDC plus DHK (n = 4), CNQX plus AP-5 (n = 6), and 0.8 mm MCPG (n = 6). Significant differences were established by the Student's t test at ***p < 0.001. E, Intracellular Ca2+variations evoked by glutamate ionophoresis estimated from the fluorescence intensity recorded from a single astrocyte filled with fluo-3. The astrocytic Ca2+ elevations evoked in control conditions (left trace) by glutamate ionophoresis (0.7 m; 5 sec; bottom line) were prevented in the presence of glutamate receptor antagonists (20 μm CNQX, 50 μm AP-5 plus 0.8 mmMCPG) (right trace).
Fig. 5.
Fig. 5.
Astrocytic Ca2+ elevations are mediated by activation of mAChRs that mobilize Ca2+from the intracellular stores. A–C, Astrocytic Ca2+ levels (top traces) and whole-cell membrane currents (bottom traces) evoked by nerve-fiber stimulation in control conditions and in the presence of 50 nm MLA, 50 μm atropine, and 1 μm thapsigargin, respectively. D, E, Relative changes from control recordings of the fluorescence intensity and membrane current amplitudes, respectively, evoked by nerve-fiber stimulation in the presence of 50 nm MLA (n = 6), 50 μm atropine (n = 8), and 1 μm thapsigargin (n = 5). Significant differences were established by the Student's t test at **p < 0.01 and ***p < 0.001.
Fig. 6.
Fig. 6.
Nerve-fiber stimulation evokes local astrocytic Ca2+ elevations. A, B, Fluorescence images of an astrocyte filled with the Ca2+indicator fluo-3 included in the patch pipette (left side of the astrocyte; arrow inB). White boxes in Bindicate ROI (15–20 μm2) in which fluorescence signals were measured. Scale bar, 9 μm. C, Normalized fluorescence intensity in regions shown in B. Nerve stimulation at 30 Hz for 5 sec is indicated by the black box in the bottom trace. Dotted lines indicate zero values estimated from the averaged resting values recorded before stimulation. While regions 1, 2, 3, and 7 increased their Ca2+ signal after nerve stimulation (ΔF/F0 > 5%), regions 4–6 did not respond to stimulation.

References

    1. Amaral DG, Witter MP. Hippocampal formation. In: Paxinos G, editor. The rat nervous system, Ed 2. Academic; London: 1995. pp. 443–493.
    1. Anderson CM, Swanson RA. Astrocyte glutamate transport: review of properties, regulation, and physiological functions. Glia. 2000;32:1–14. - PubMed
    1. Araque A, Parpura V, Sanzgiri RP, Haydon PG. Glutamate-dependent astrocyte modulation of synaptic transmission between cultured hippocampal neurons. Eur J Neurosci. 1998a;10:2129–2142. - PubMed
    1. Araque A, Sanzgiri RP, Parpura V, Haydon PG. Calcium elevation in astrocytes causes an NMDA receptor-dependent increase in the frequency of miniature synaptic currents in cultured hippocampal neurons. J Neurosci. 1998b;18:6822–6829. - PMC - PubMed
    1. Araque A, Parpura V, Sanzgiri RP, Haydon PG. Tripartite synapses: glia, the unacknowledged partner. Trends Neurosci. 1999;22:208–215. - PubMed

Publication types

MeSH terms

LinkOut - more resources