. 2002 Apr 1;22(7):2718-29.
doi: 10.1523/JNEUROSCI.22-07-02718.2002.

Gene expression profiling reveals alterations of specific metabolic pathways in schizophrenia

Affiliations

Gene expression profiling reveals alterations of specific metabolic pathways in schizophrenia

Frank A Middleton et al. J Neurosci. .

Abstract

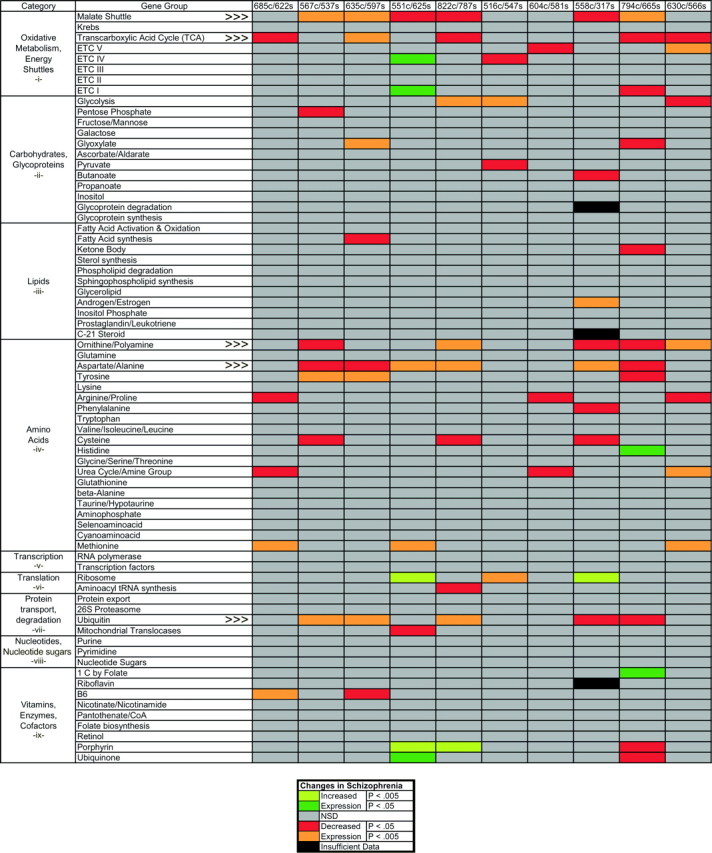
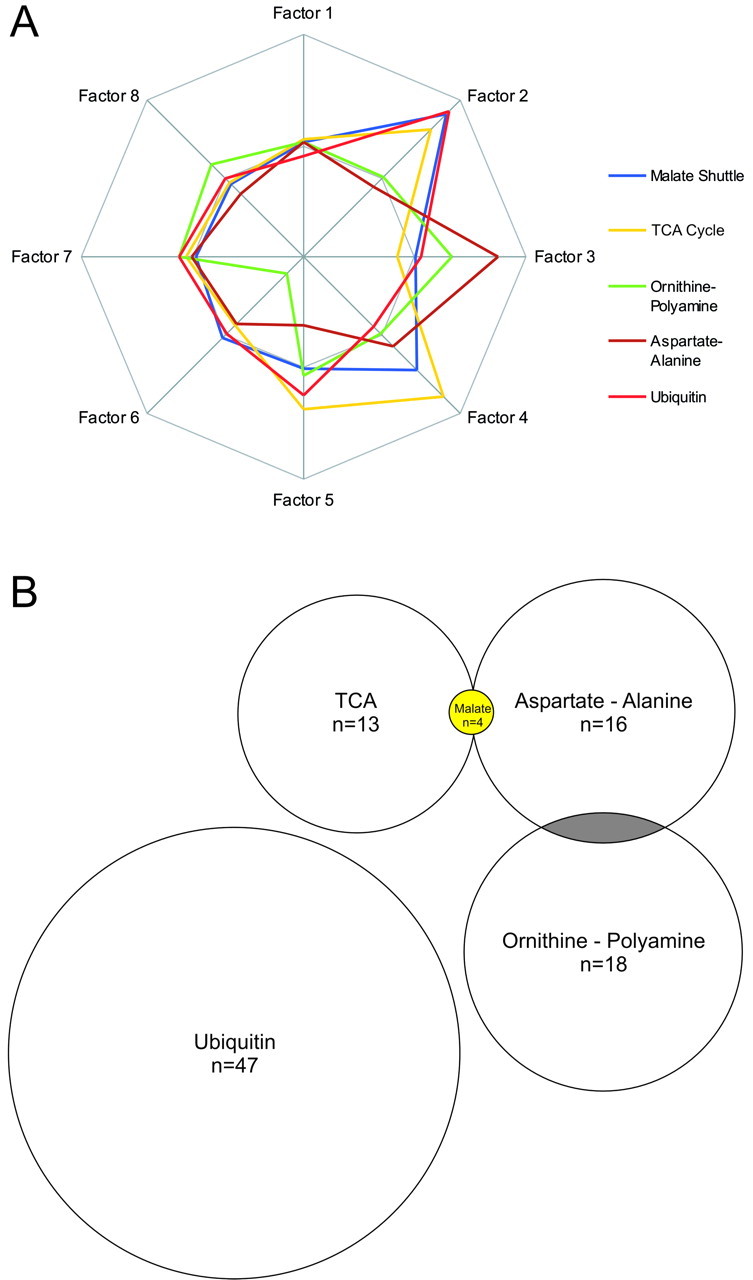
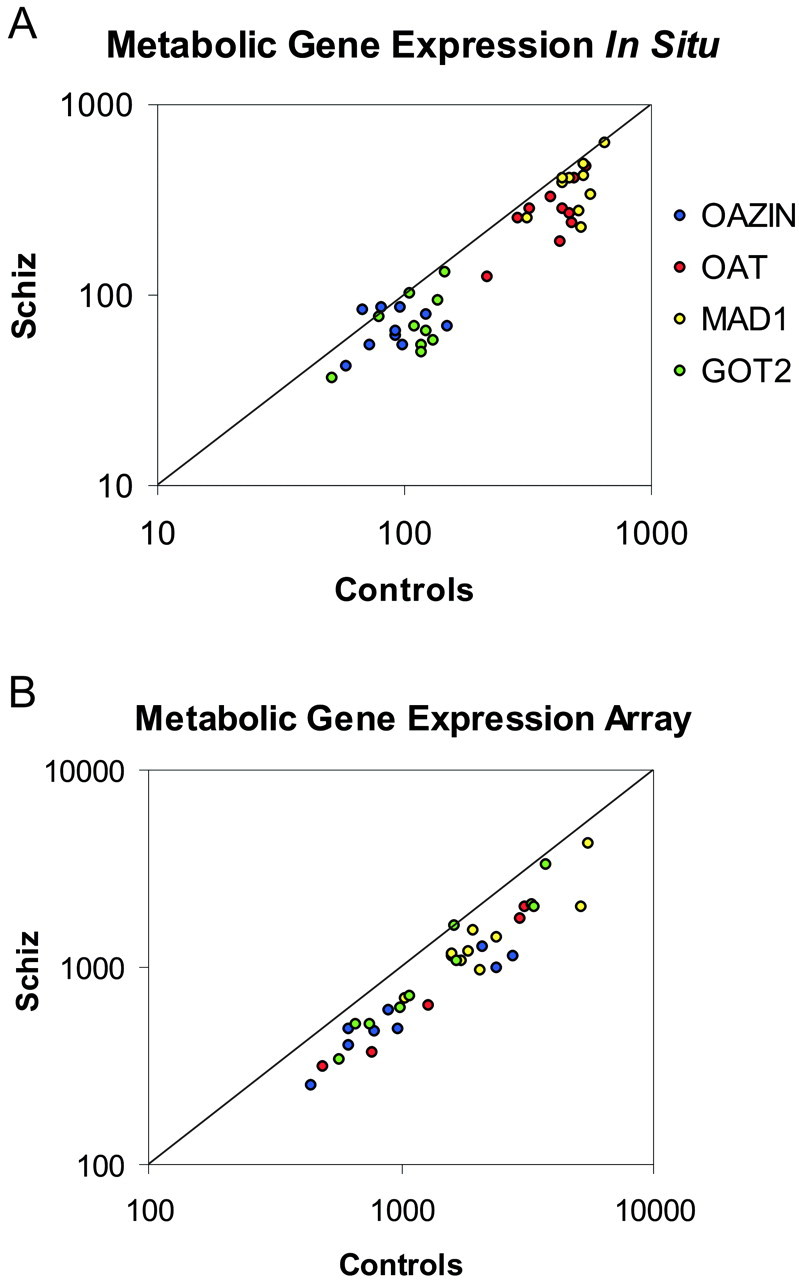
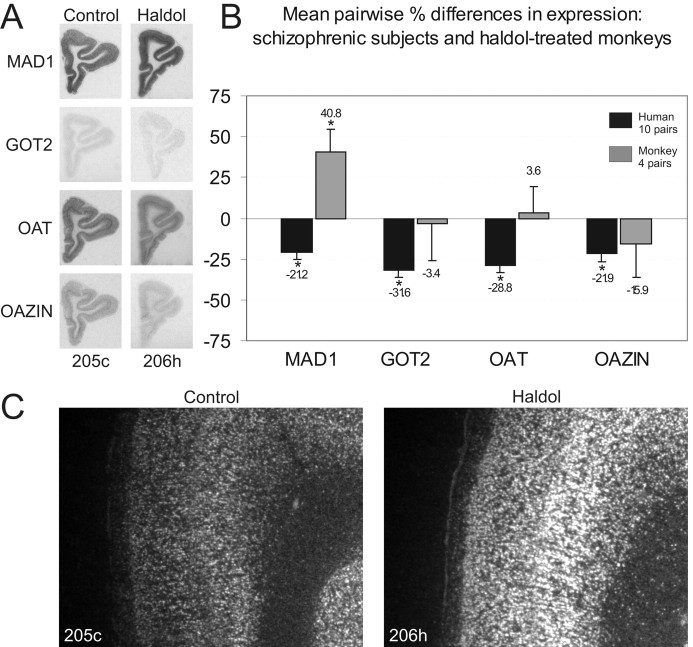
Dysfunction of the dorsal prefrontal cortex (PFC) in schizophrenia may be associated with alterations in the regulation of brain metabolism. To determine whether abnormal expression of genes encoding proteins involved in cellular metabolism contributes to this dysfunction, we used cDNA microarrays to perform gene expression profiling of all major metabolic pathways in postmortem samples of PFC area 9 from 10 subjects with schizophrenia and 10 matched control subjects. Genes comprising 71 metabolic pathways were assessed in each pair, and only five pathways showed consistent changes (decreases) in subjects with schizophrenia. Reductions in expression were identified for genes involved in the regulation of ornithine and polyamine metabolism, the mitochondrial malate shuttle system, the transcarboxylic acid cycle, aspartate and alanine metabolism, and ubiquitin metabolism. Interestingly, although most of the metabolic genes that were consistently decreased across subjects with schizophrenia were not similarly decreased in haloperidol-treated monkeys, the transcript encoding the cytosolic form of malate dehydrogenase displayed prominent drug-associated increases in expression compared with untreated animals. These molecular analyses implicate a highly specific pattern of metabolic alterations in the PFC of subjects with schizophrenia and raise the possibility that antipsychotic medications may exert a therapeutic effect, in part, by normalizing some of these changes.


Figures

Fig. 1.
Fig. 1.
Metabolic gene group expression in schizophrenia. Genes in 71 different metabolic groups, belonging to several different categories of cellular functions, were analyzed in 10 subjects with schizophrenia and their matched controls. For each gene, a pairwise differential expression ratio was calculated and converted into a Z score for each array comparison. TheZ score distribution of all of the genes present in each gene group was then compared with the Z score distribution of each array using ANOVA, and the significance of the differences was estimated with a post hoc paired Scheffe's F test. The p values from these tests were entered into a table that was pseudocolored according to the level of the effect (key at the bottom). An average og 7.2 of the 71 gene groups were significantly changed in each of the five pairs compared using the UniGEM V microarray (right), whereas an average of 7.6 gene groups were changed in each of the five pairs compared using the UniGEM V2 microarray (left). Only five genes groups exhibited changes in expression (decreases) in five or more comparisons (indicated by arrowheads). The decreases in these five gene groups reached significance slightly more often in the UniGEM V2 comparisons (mean, 3.2 of 5) than the UniGEM V comparisons (mean, 2.2 of 5), although a complete shift of the mean Z scores of these groups was evident in all comparisons (see Fig. 2).
Fig. 2.
Fig. 2.
Mean pairwise Z score distributions: five highly affected and one unaffected gene group. The distribution of mean Z scores for the five most consistently affected gene groups (see Fig. 1) is shown for each array comparison, along with the mean Z scores for an unaffected gene group, RNA polymerases (RNA Poly). Interestingly, the mean Z score distributions for the five most affected gene groups was highly correlated among seven of the 10 subject pairs (Pearson's R range, 0.77–0.99).Asp/Ala, Aspartate–alanine metabolism;Orn/PA, ornithine–polyamine metabolism.
Fig. 3.
Fig. 3.
Correlations and connections between affected gene groups. A, To estimate the mathematical relationships between the effects on different gene groups, the normalizedp values from Figure 1 were used to calculate a correlation matrix and perform a PCA. The PCA revealed strong relationships between the effects on the malate shuttle, TCA (citrate) cycle, and ubiquitin metabolism gene groups (Factor 2) and between aspartate–alanine metabolism and ornithine–polyamine metabolism (Factor 3). Variance proportions for factors 1–8 were 0.308, 0.233, 0.169, 0.091, 0.069, 0.055, 0.054, and 0.020, respectively. B, Connections, in the form of shared genes, existed between four of the five most affected gene groups. The size of these gene groups are drawn to scale, with the presence of significantly affected overlapping genes indicted inyellow and nonsignificantly affected overlapping genes shown in gray.
Fig. 4.
Fig. 4.
In situ hybridization confirms microarray data. Four genes (OAZIN, OAT, MAD1, and GOT2) were chosen for verification based on their consistency in changes (see Table 2). The expression of these genes was significantly decreased in both thein situ hybridization (A) and microarray (B) studies of 10 subjects with schizophrenia. In both A and B, the pairwise expression of each gene is plotted as a ratio of the level in the control subject compared with the level in the subject with schizophrenia. Genes expressed at a higher level in controls are located below the unity line, whereas genes expressed at a higher level in subjects with schizophrenia are located above the unity line. Levels of expression in A are in disintegrations per minute per square millimeter, and levels in B represent balanced fluorescent signal intensity.
Fig. 5.
Fig. 5.
Pairwise expression differences in metabolic gene expression. Each of the four metabolic genes we examined was significantly decreased in subjects with schizophrenia, using both paired and unpaired ANOVA comparisons. Mean levels of expression for each subject group are indicated by the black bars. Mean pairwise differences in expression for subjects with schizophrenia are given in the boxes at the bottom of eachpanel.
Fig. 6.
Fig. 6.
Laminar localization of transcript expression. Each of the four genes examined was expressed in neurons, with little or no signal present in white matter. These genes exhibited different patterns and intensities but were all decreased in subjects with schizophrenia (right) compared with control subjects (left). Note that all of photomicrographs were taken using identical radiographic emulsion exposure times and identical illumination conditions. Roman numerals indicate cortical laminas.
Fig. 7.
Fig. 7.
Selective increases in MAD1 expression in haloperidol-treated monkeys. None of the four genes we examined in haloperidol-treated monkeys (A) exhibited the same significant decreases in expression as subjects with schizophrenia (B). However, one of these genes (MAD1) exhibited significant increases in expression. C, Enlarged views of the dorsomedial convexity of the PFC illustrating the change in MAD1 expression in medial area 9. The increased expression of MAD1 was specific to deep cortical layers. *p < 0.05.

References

    1. Alberts B, Bray D, Lewis J, Raff M, Roberts K, Watson JD. Molecular biology of the cell, Ed 2. Garland; New York: 1989.
    1. Andreasen NC, Rezai K, Alliger R, Swayze VW, II, Flaum M, Kirchner P, Cohen G, O'Leary DS. Hypofrontality in neuroleptic-naive patients and in patients with chronic schizophrenia: assessment with xenon 133 single photon emission computed tomography and the Tower of London. Arch Gen Psychiatry. 1992;49:943–958. - PubMed
    1. Assies J, Lieverse R, Vreken P, Wanders RJ, Dingemans PM, Linszen DH. Significantly reduced docosahexaenoic and docosapentaenoic acid concentrations in erythrocyte membranes from schizophrenic patients compared with a carefully matched control group. Biol Psychiatry. 2001;49:510–522. - PubMed
    1. Auer DP, Wilke M, Grabner A, Heidenreich JO, Bronisch T, Wetter TC. Reduced NAA in the thalamus, altered membrane, glial metabolism in schizophrenic patients detected by 1H-MRS, tissue segmentation. Schizophr Res. 2001;52:87–99. - PubMed
    1. Berman KF, Zec RF, Weinberger DR. Physiological dysfunction of dorsolateral prefrontal cortex in schizophrenia. II. Role of neuroleptic treatment, attention and mental effort. Arch Gen Psychiatry. 1986;43:126–135. - PubMed

Publication types

MeSH terms