. 2002 Apr 1;22(7):2737-47.
doi: 10.1523/JNEUROSCI.22-07-02737.2002.

Functional asymmetries in ON and OFF ganglion cells of primate retina

Affiliations

Functional asymmetries in ON and OFF ganglion cells of primate retina

E J Chichilnisky et al. J Neurosci. .

Erratum in

  • J Neurosci 2002 Oct 1;22(19):1a

Abstract

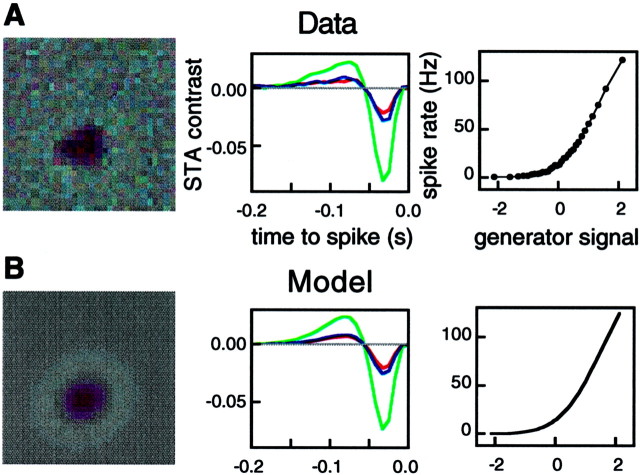
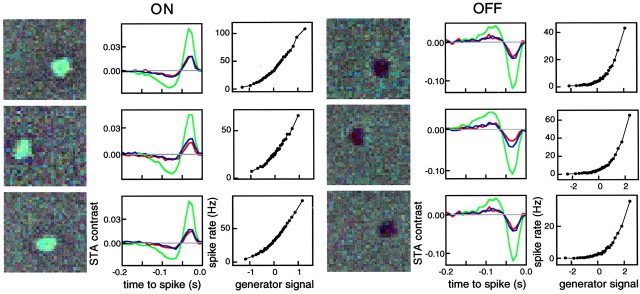
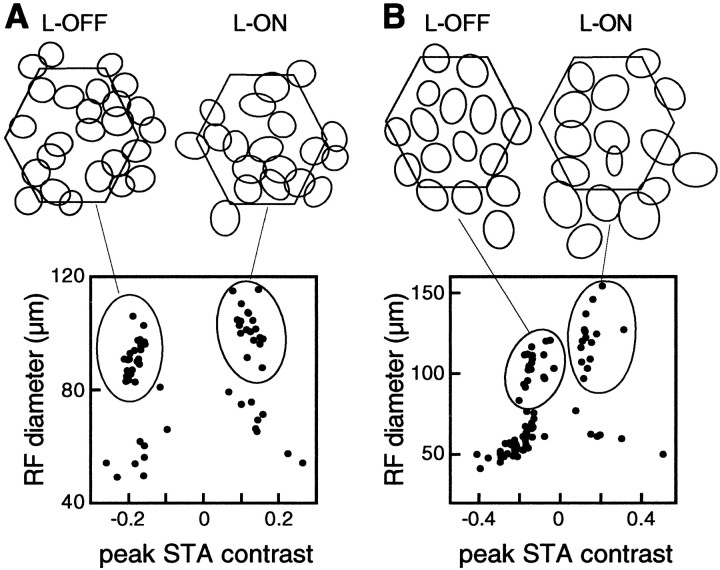
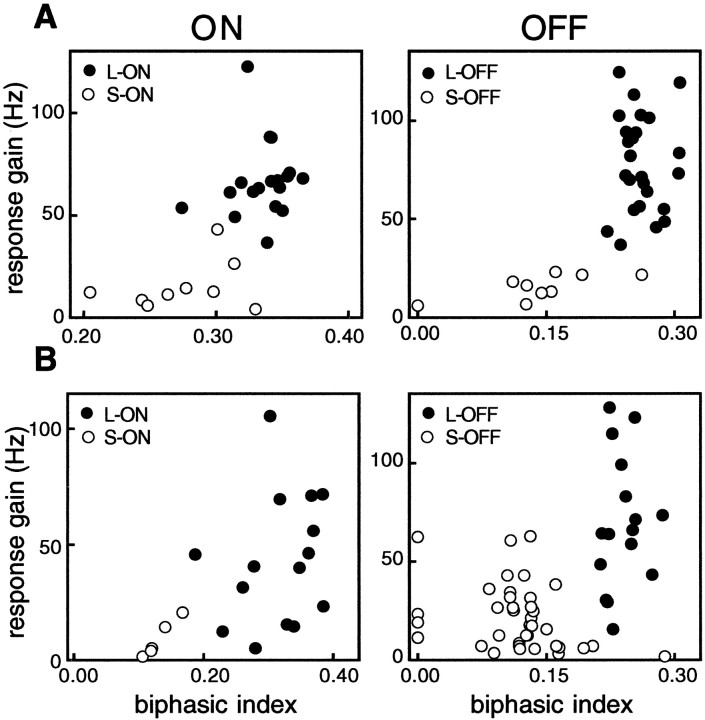
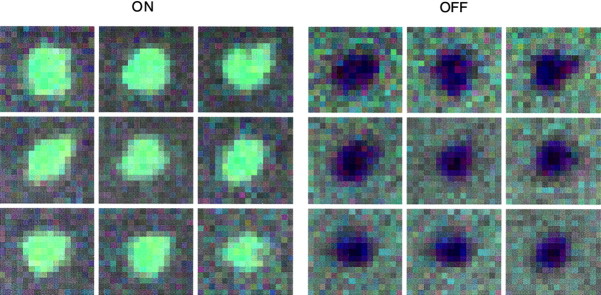
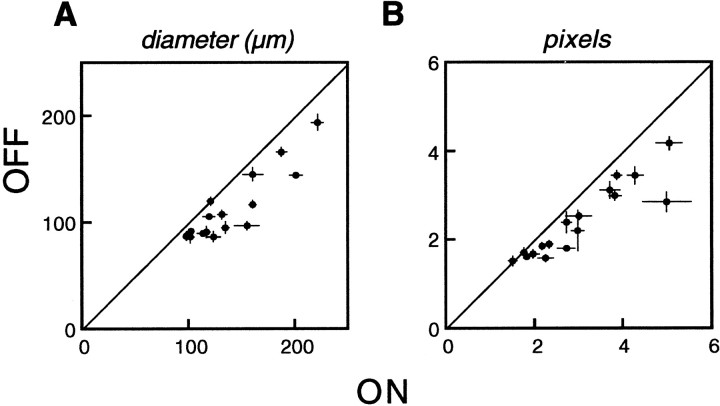
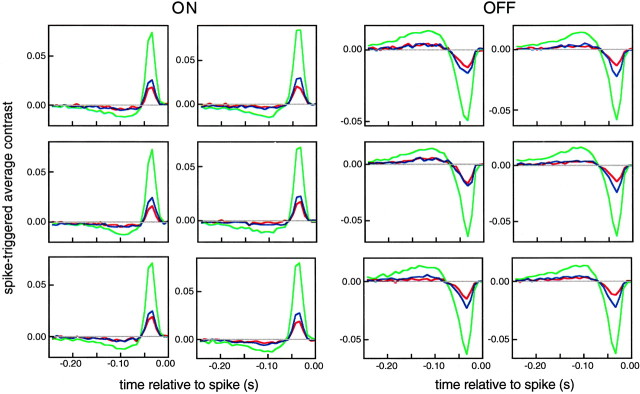
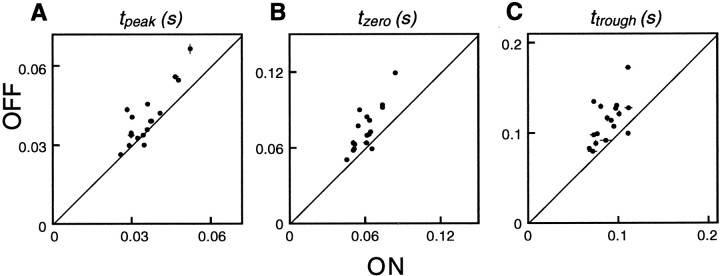
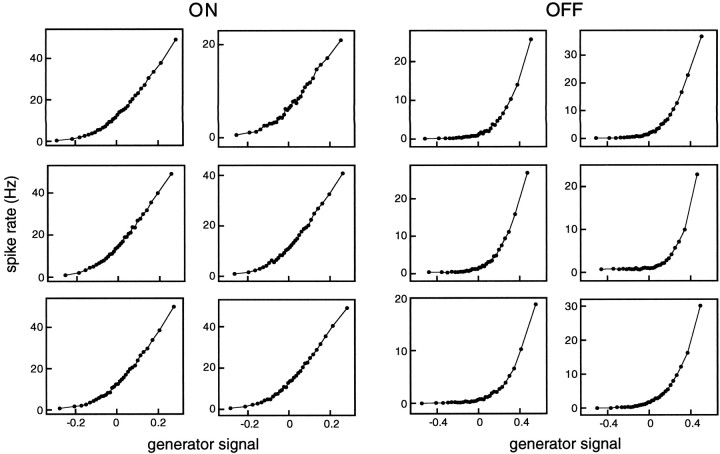
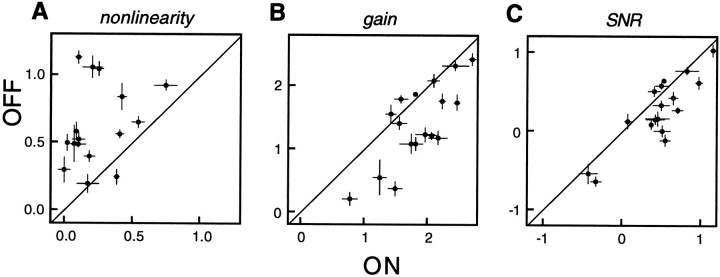
Functional asymmetries in the ON and OFF pathways of the primate visual system were examined using simultaneous multi-electrode recordings from dozens of retinal ganglion cells (RGCs) in vitro. Light responses of RGCs were characterized using white noise stimulation. Two distinct functional types of cells frequently encountered, one ON and one OFF, had non-opponent spectral sensitivity, relatively high response gain, transient light responses, and large receptive fields (RFs) that tiled the region of retina recorded, suggesting that they belonged to the same morphological cell class, most likely parasol. Three principal functional asymmetries were observed. (1) Receptive fields of ON cells were 20% larger in diameter than those of OFF cells, resulting in higher full-field sensitivity. (2) ON cells had faster response kinetics than OFF cells, with a 10-20% shorter time to peak, trough and zero crossing in the biphasic temporal impulse response. (3) ON cells had more nearly linear light responses and were capable of signaling decrements, whereas OFF cells had more strongly rectifying responses that provided little information about increments. These findings suggest specific mechanistic asymmetries in retinal ON and OFF circuits and differences in visual performance on the basis of the activity of ON and OFF parasol cells.


Figures

Fig. 1.
Fig. 1.
Characterization of light response and parametric fits. A, Left panel, The average stimulus observed 33 msec (4 frames, near time-to-peak) before a spike in one RGC. The dark central region reveals the receptive field of the cell. Middle panel, Average time course of contrast of the red, green, andblue display phosphors in the 250 msec preceding a spike, summed over 36 pixels in the center of the receptive field. The dominant negative lobe indicates that this is an OFF cell. Right panel, Average firing rate as a function of the generator signal (stimulus weighted by STA) observed during white noise stimulation. B, Parametric fits, as described in Materials and Methods, to the corresponding panels inA.
Fig. 2.
Fig. 2.
Characterization of light response for three ON and three OFF macaque RGCs, recorded simultaneously. Three panels for each cell show, from left to right, the average stimulus observed 33 msec (4 frames, near time-to-peak) before a spike, the time course of contrast of the red,green, and blue display phosphors in the 200 msec preceding a spike, and the average firing rate as a function of the generator signal (stimulus weighted by STA) observed during white noise stimulation, in the same format as Figure1A.
Fig. 3.
Fig. 3.
Cell classification for two preparations (A, B). A, Scatter plot shows the RF diameter and peak STA contrast for each of 62 cells recorded simultaneously. Clusters defining L-ON cells (right) and L-OFF cells (left) are indicated by ovals. Top panel shows outlines of RFs (1 SD boundary of Gaussian fit; see Materials and Methods) for all L-OFF cells and L-ON cells in this preparation.B, Data from 85 cells recorded in a second preparation, in the same format as A.
Fig. 4.
Fig. 4.
Kinetics and response gain for cells with large and small RFs, for two preparations (A,B). A, Left, Response gain (derivative of spike rate with respect to contrast of an achromatic 15 msec full-field flash, deduced from white noise measurements) and index of biphasicity (absolute value of ratio of trough to peak of STA time course) for all L-ON and all S-ON cells in the preparation of Figure3A. L-ON cells are shown by filled symbols; S-ON cells are shown by open symbols.Right, Same measurements for all L-OFF and S-OFF cells in the same preparation. L-OFF cells are shown by filled symbols; S-OFF cells are shown by open symbols.B, Same as A, for the data set from Figure 3B.
Fig. 5.
Fig. 5.
Comparison of L-ON and L-OFF cells to parasol cells. Small squares show DF field diameters of individual parasol cells as a function of retinal eccentricity, replotted from Watanabe and Rodieck (1989). Open circles show RF diameters of individual magnocellular-projecting RGCs, replotted from Croner and Kaplan (1995), multiplied by 1.57, a value chosen by linear regression to bring RF diameters into registry with DF diameters. Filled circles show mean RF diameters of all L-ON and L-OFF cells from each of nine preparations, also multiplied by 1.57.
Fig. 6.
Fig. 6.
Receptive field size asymmetry. For nine L-ON (left) and nine L-OFF (right) cells recorded simultaneously, the average stimulus on the display 45 msec (3 frames, near time-to-peak) before a spike is shown in the same format as Figure 1. Cells of each group are sorted by RF size, from largest (top left) to smallest (bottom right). The RF location of each cell is different; these images have been cropped to the region immediately surrounding the RF.
Fig. 7.
Fig. 7.
Receptive field size asymmetry summary.A, Each point shows the mean receptive field diameter of all L-ON cells and all L-OFF cells recorded in one preparation. Error bars, sometimes smaller than points, indicate 1 SEM. The diagonal line indicates equality for L-ON and L-OFF cells. Data from 169 L-ON and 162 L-OFF cells from 17 preparations are represented. B, Each point shows the square root of the mean number of pixels for L-ON and L-OFF cells for which the rms energy in the STA exceeded 25% of the rms energy of the strongest pixel.
Fig. 8.
Fig. 8.
Kinetic asymmetry. STA time courses are shown for six L-ON (left) and six L-OFF (right) cells recorded simultaneously. Each panel shows the average time course of red, green, andblue display phosophor contrast in the 250 msec preceding a spike, summed over the center of the RF, as in Figure1.
Fig. 9.
Fig. 9.
Kinetic asymmetry summary. A, Eachpoint shows the mean time-to-peak of the STA time course for all L-ON cells and all L-OFF cells recorded in one preparation. Error bars indicate 1 SEM. Data from 169 L-ON and 162 L-OFF cells from 17 preparations are represented. B, Mean time to zero crossing for L-ON and L-OFF cells. C, Mean time to trough for L-ON and L-OFF cells.
Fig. 10.
Fig. 10.
Nonlinearity asymmetry. Each panelshows firing rate as a function of generator signal (stimulus weighted by STA) for one cell obtained during white noise stimulation, as in Figure 1. Data are shown for six L-ON cells (left) and six L-OFF cells (right) recorded simultaneously.
Fig. 11.
Fig. 11.
Nonlinearity, gain, and SNR asymmetry summary. A, Each point shows the mean nonlinearity index for all L-ON cells and all L-OFF cells recorded in one preparation. Error bars indicate 1 SEM. Nonlinearity index is the logarithm of the ratio of the slope of the nonlinearity at the maximum generator signal value observed to the slope at zero generator signal. Data from 169 L-ON and 162 L-OFF cells from 17 preparations are represented. B, Mean logarithm of response gain for L-ON cells and L-OFF cells. Response gain is the derivative of firing rate (spikes per second) with respect to the contrast of a brief (15 or 8.33 msec) achromatic full-field flash deduced from white noise measurements. C, Mean logarithm of signal-to-noise ratio (SNR) for L-ON and L-OFF cells. SNR is defined as the response gain divided by the SD of spike counts observed at zero generator signal.

References

    1. Benardete EA, Kaplan E. The receptive field of the primate P retinal ganglion cell, I: Linear dynamics. Vis Neurosci. 1997;14:169–185. - PubMed
    1. Benardete EA, Kaplan E. The dynamics of primate M retinal ganglion cells. Vis Neurosci. 1999;16:355–368. - PubMed
    1. Bowen RW, Pokorny J, Smith VC. Sawtooth contrast sensitivity: decrements have the edge. Vision Res. 1989;29:1501–1509. - PubMed
    1. Chander D, Chichilnisky EJ. Adaptation to temporal contrast in primate and salamander retina. J Neurosci. 2001;21:9904–9916. - PMC - PubMed
    1. Chichilnisky EJ. A simple white noise analysis of neuronal light responses. Network: Comput Neural Syst. 2001;12:199–213. - PubMed

Publication types

MeSH terms

LinkOut - more resources