. 2002 Apr 1;22(7):2945-55.
doi: 10.1523/JNEUROSCI.22-07-02945.2002.

Development of response timing and direction selectivity in cat visual thalamus and cortex

Affiliations

Development of response timing and direction selectivity in cat visual thalamus and cortex

Alan B Saul et al. J Neurosci. .

Abstract

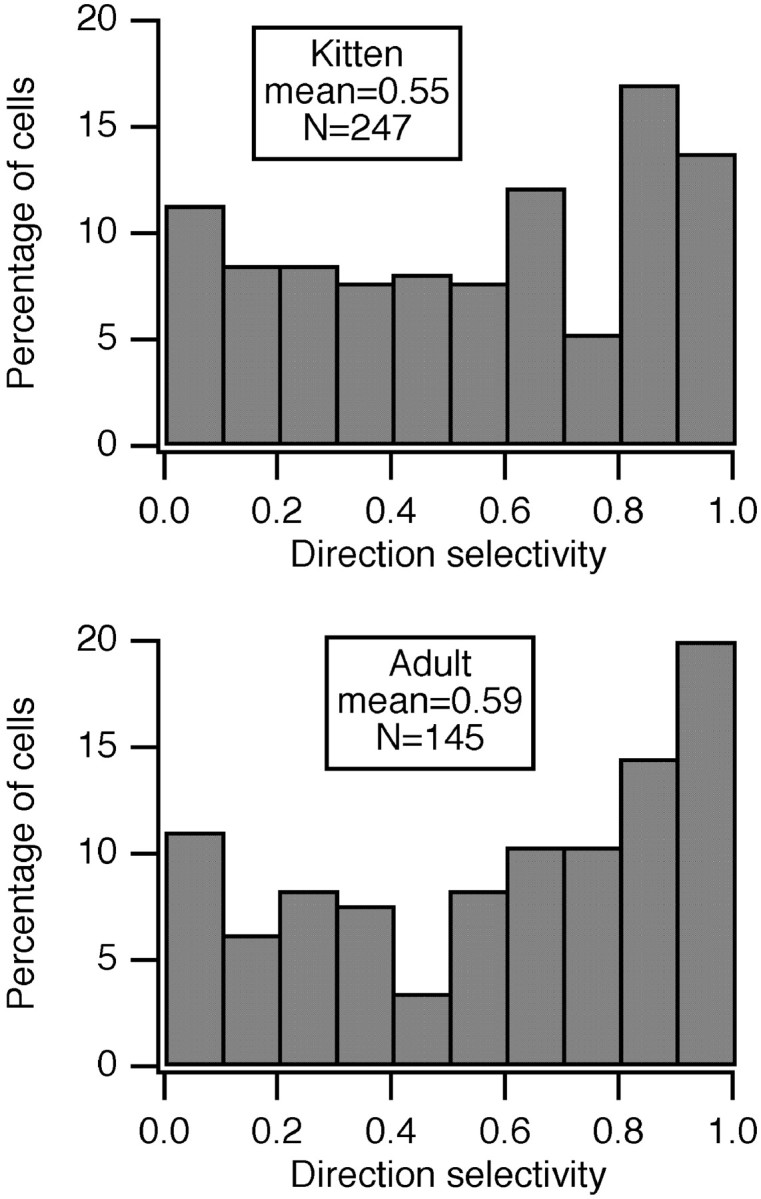
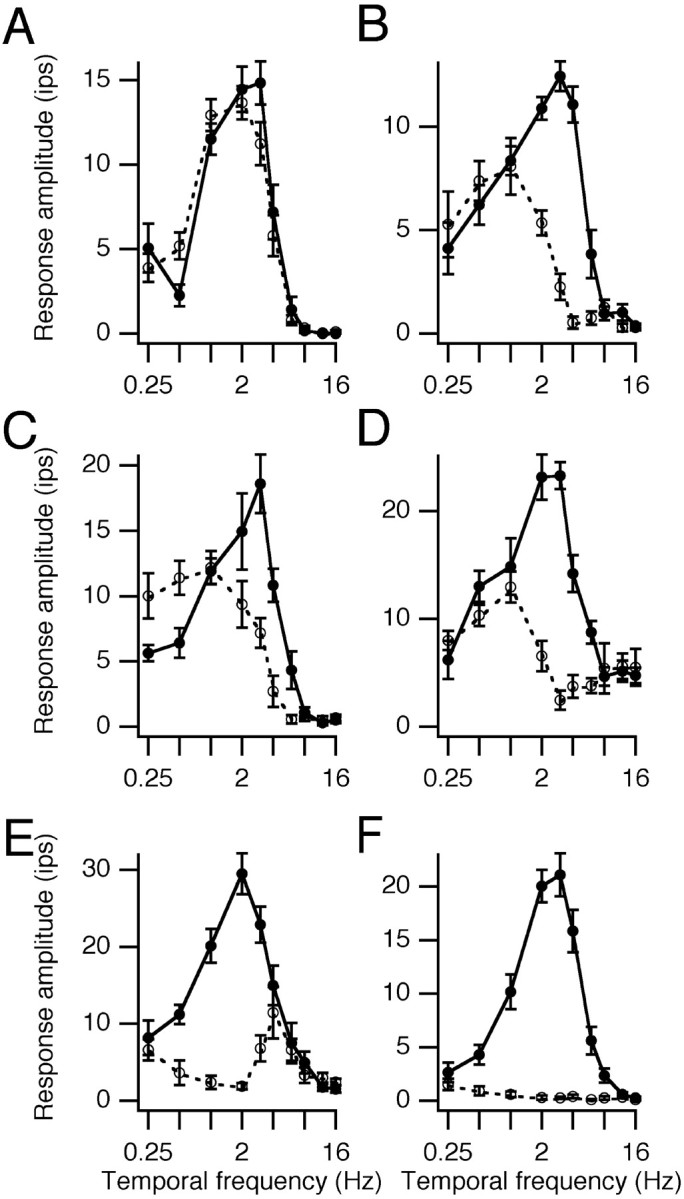
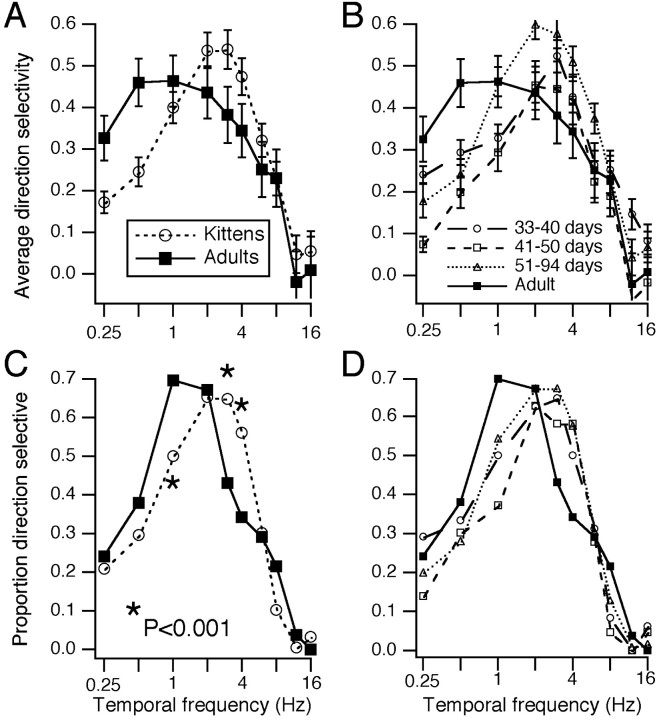
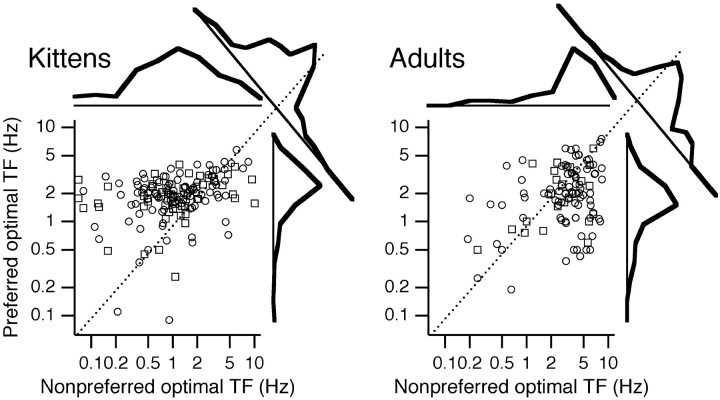
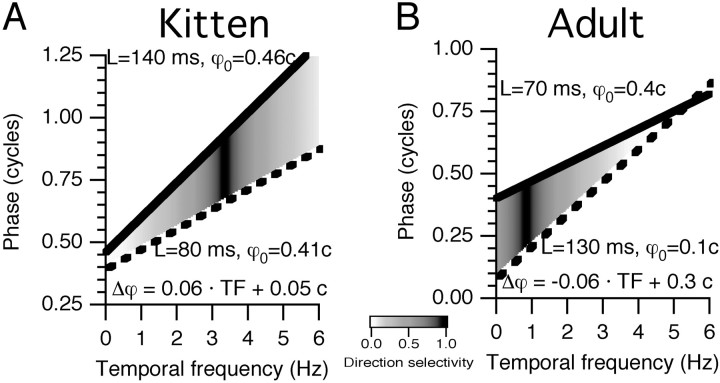
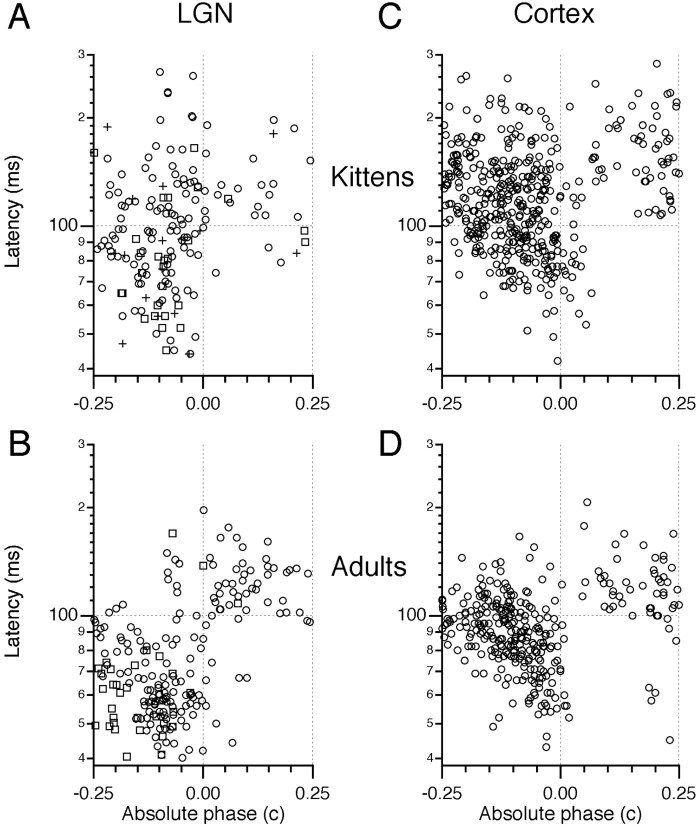
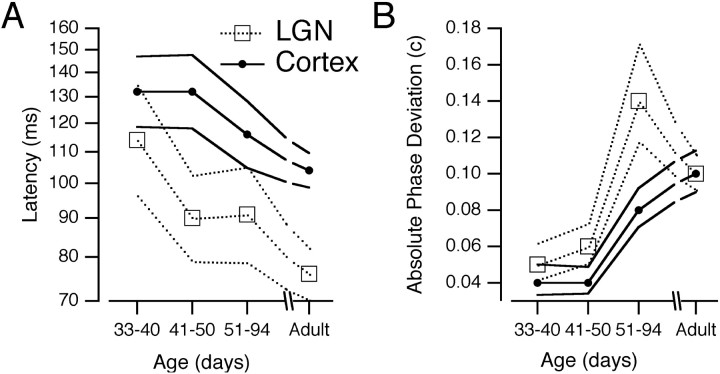
Single-unit recordings were made in the dorsal lateral geniculate nucleus (LGN) and visual cortex of kittens that were 4-13 weeks of age. Responses to visual stimuli were analyzed to determine the relationship between two related facets of the behaviors of the cells: direction selectivity (DS) and timing. DS depends on timing differences within the receptive field. Cortical DS was present at all ages, but its temporal frequency tuning changed. In kittens, DS was more common at high (approximately 4 Hz) than low ( approximately 1 Hz) temporal frequencies. This is in contrast to adults, in which DS is tuned to low frequencies, more common at 1 Hz than at 4 Hz (Saul and Humphrey, 1992a). In adult cats, the LGN provides the cortex with a wide range of timings that are also observable in cortical receptive fields (Saul and Humphrey, 1990, 1992b; Alonso et al., 2001). In kittens, LGN and cortical timing were immature. Most cells showed long-latency sustained responses. At low temporal frequencies, the variance in timing was small, but at higher frequencies, all timings were well represented. The timing data thus matched the temporal frequency tuning of DS. Kittens show DS at high temporal frequencies because of the abundance of inputs with different timing at high frequencies. As cells in the LGN mature, more low-frequency timing differences become available to the cortex, allowing DS at low frequencies to become possible for more cortical cells.


Figures

Fig. 1.
Fig. 1.
Distribution of DS in area 17 neurons did not change with age. Orientation tuning was determined across 360° at the optimal spatial and temporal frequency, and Gaussian functions were fit to the tuning in each direction. From the peaks of these Gaussian functions, the ratio of the difference to the sum was taken as the DS index shown here.
Fig. 2.
Fig. 2.
Temporal frequency tuning in each direction of motion is shown for six cortical cells. Amplitude is the first harmonic response for simple cells and the DC response for the complex cell.Solid lines are preferred directions and dashed lines are nonpreferred directions. Error barsare SEMs. A, Layer 5A simple cell from a 46-d-old kitten. B, Layer 2/3 simple cell from a 63-d-old kitten.C, Layer 5 simple cell from a 36-d-old kitten.D, Layer 4/5 complex cell from a 42-d-old kitten.E, Layer 4/5 simple cell from an 83-d-old kitten.F, Layer 4 simple cell from a 67-d-old kitten.
Fig. 3.
Fig. 3.
Temporal frequency tuning of DS across the population. A, Values of DS at each temporal frequency were averaged across cells in each age group. Error bars represent SEMs. DS values could be negative, because a preferred direction was designated on the basis of the average responses, and the DS at very high temporal frequencies was in fact slightly negative in some cases. The number of cells was 216 and 54 for kittens and adults, respectively. B, The kitten data in A are broken down into three groups. The number of cells was 48, 43, and 125 for 33- to 40-d-old, 41- to 50-d-old, and 51- to 94-d-old kittens, respectively. C, Cells were classified as direction selective or not at each temporal frequency based on a DS index of >0.33 and a t score of >2. Numbers of cells are the same as in A. Points marked with asterisks were significantly different at the 0.001 level based on the proportions test. D, The breakdown of the kitten data in C into the three separate age groups.
Fig. 4.
Fig. 4.
Optimal temporal frequency in each direction. A difference of Gaussians fit was made to tuning curves. Cells for which the fit was inadequate for the nonpreferred direction, because insufficient spikes were evoked from strongly and broadly direction-selective cells, were excluded. Simple cells are shown withcircles; complex cells are shown withsquares. Histograms above and to theright of each plot show the distribution of optimal frequencies for each direction. Histograms across the diagonals (dotted lines) show the distribution of distance between preferred and nonpreferred optimal frequencies. These distributions differed between kittens and adults (p < 0.001; t test) and between each of the groups of kittens and the adults, but not between any of the kitten groups. Sample sizes were 154 and 116 for kittens and adults, respectively. Geometric means, in Hertz, for optimal temporal frequencies in the preferred and nonpreferred directions for each age group are (1.9, 1.0) and (2.0, 2.9), respectively. For 33- to 40-d-old (n = 32), 41- to 50-d-old (n = 33), and 51- to 94-d-old (n = 89) kittens, respectively, the values were (1.9, 0.9), (1.9, 1.0), and (1.9, 1.0), respectively. TF, Temporal frequency.
Fig. 5.
Fig. 5.
Linking timing to DS. The timing of hypothetical inputs to a cortical cell are schematized for kittens and adult cats. Two typical inputs are chosen in each case, characterized by the slope and intercept of their phase versus temporal frequency plots. The phase difference between the two inputs would determine the DS of the cortical cell as shown. A, In kittens, inputs typically differ in latency but not absolute phase. Here, the inputs are only 0.05 c apart at 0 Hz, but their latency difference is 60 msec. This would create DS at 4 Hz but not at 1 Hz. B, In adults, one readily finds lagged and nonlagged cells that differ in both latency and absolute phase. Here, the inputs are separated by 0.3 c at 0 Hz, but because of their 60 msec latency difference, this phase difference disappears by 5 Hz. The hypothetical cortical cell would be direction selective at 1 Hz but not at 4 Hz.L, Latency; TF, temporal frequency; ϕ, phase; ϕ0, absolute phase.
Fig. 6.
Fig. 6.
Responses from four OFF-center LGN X cells.A–D, Two relatively immature cells from a 33-d-old kitten (gray traces in A andD, map in B) and from a 35-d-old kitten (black traces and map inC). A, Poststimulus time histograms built up from 100 cycles of flashing spots, smoothed with a Gaussian function of 10 msec half-width. The luminance waveform is shown at thebottom and stepped between 25, 15, and 5 cd/m2. Histogram heights were normalized. Thegray histogram peaked at 20 impulses/sec (ips) and theblack histogram peaked at 50 ips. Latencies were measured from spot onset (at 2 sec) to 50% maximal firing (half-rise) and from spot offset (at 3 sec) to the point 50% below the average firing rate during the 100 msec before offset (half-fall).B, Space–time map derived from sparse noise stimulation with a 0.3 × 5° bar at 32 positions across 4°. Each dark or bright bar was repeatedly presented for 40 msec exposures over a total run length of 480 sec. The pseudorandom stimulus was reverse correlated with the spike train, the dark map was subtracted from the bright map, and negative values are shown in this contour map with dotted lines. For these off-center cells, dotted contours are interpreted as representing dark excitation, andsolid contours represent dark inhibition. Data were slightly smoothed in the frequency domain by low-pass filtering with a Gaussian function of half-widths 32 Hz and 6 cycles/°.C, Space–time map from the cell shown with black traces in A and D. Bars were 0.5 × 6°, presented for 1120 sec. D, Phase values from responses to sinusoidally modulated stationary spots. At each temporal frequency, 16 trials of 4 sec each were presented randomly interleaved, and the first harmonic response was computed for each trial. These responses were averaged over the 16 trials, and these means and SEs are shown. Both cells had high-frequency cutoffs of ∼6 Hz. Dashed lines show weighted linear regressions to the phase data. E–H, Responses from two relatively mature cells. The format is parallel to that of A–D. Thegray traces and map in Fshow a cell from a 62-d-old kitten; the black traces andmap in G are from a cell in a 90-d-old kitten. E, The gray trace peaked at 200 ips, and the black trace peaked at 40 ips.F, Bars were 0.3 × 3°, presented for 1632 sec over 3°. G, Bars were 0.3 × 3°, presented for 320 sec over 4°. H, These cells both responded out to ∼16 Hz.
Fig. 7.
Fig. 7.
Development of response timing in the LGN and cortex. Latency and absolute phase plots are shown for each age group and area. A, B, LGN results, withcircles for X cells and squares for Y cells. Cells that were not classified as X or Y are shown withplus signs. Dotted lines were drawn at 100 msec latency and at an absolute phase of 0 c as landmarks, indicating where lagged and nonlagged cells are distinguished in adults, but these lines do not serve to divide cells in kittens. Sample sizes are 170 and 208 for kittens and adults, respectively. C, D, Area 17 timing illustrated by latency and absolute phase values from individual positions in simple-cell receptive fields. Each cell could contribute several points to these figures. Sample sizes were 441 in C and 316 in D.
Fig. 8.
Fig. 8.
Progressive changes in timing. Results from the LGN and from cortical simple cells in or near layer 4 are compared. Sample sizes for the four groups were 51, 62, 57, and 208 LGN cells and 48, 62, 112, and 153 positions in layer 4 simple cells. A, Arithmetic mean latencies are shown with their 95% confidence intervals. B, The absolute deviations of absolute phase values from their means were averaged for each group of cells. Small absolute phase deviations arise when timing at low frequencies is relatively uniform, and large values arise when timing varies widely at low frequencies.

References

    1. Albrecht DG, Geisler WS. Motion selectivity and the contrast-response function of simple cells in the visual cortex. Vis Neurosci. 1991;7:531–546. - PubMed
    1. Albus K, Wolf W. Early postnatal development of neuronal function in the kitten's visual cortex: a laminar analysis. J Physiol (Lond) 1984;348:153–185. - PMC - PubMed
    1. Alonso J-M, Usrey WM, Reid RC. Rules of connectivity between geniculate cells and simple cells in cat primary visual cortex. J Neurosci. 2001;21:4002–4015. - PMC - PubMed
    1. Beidenbach MA, Stevens CF. Electrical activity in cat olfactory cortex produced by synchronous orthodromic volleys. J Neurophysiol. 1969;32:193–203. - PubMed
    1. Berardi N, Morrone MC. Development of γ-aminobutyric acid mediated inhibition of X cells of the cat lateral geniculate nucleus. J Physiol (Lond) 1984;357:525–537. - PMC - PubMed

Publication types