. 2002 Apr 1;22(7):2963-76.
doi: 10.1523/JNEUROSCI.22-07-02963.2002.

Activity patterns in a model for the subthalamopallidal network of the basal ganglia

Affiliations

Activity patterns in a model for the subthalamopallidal network of the basal ganglia

D Terman et al. J Neurosci. .

Abstract

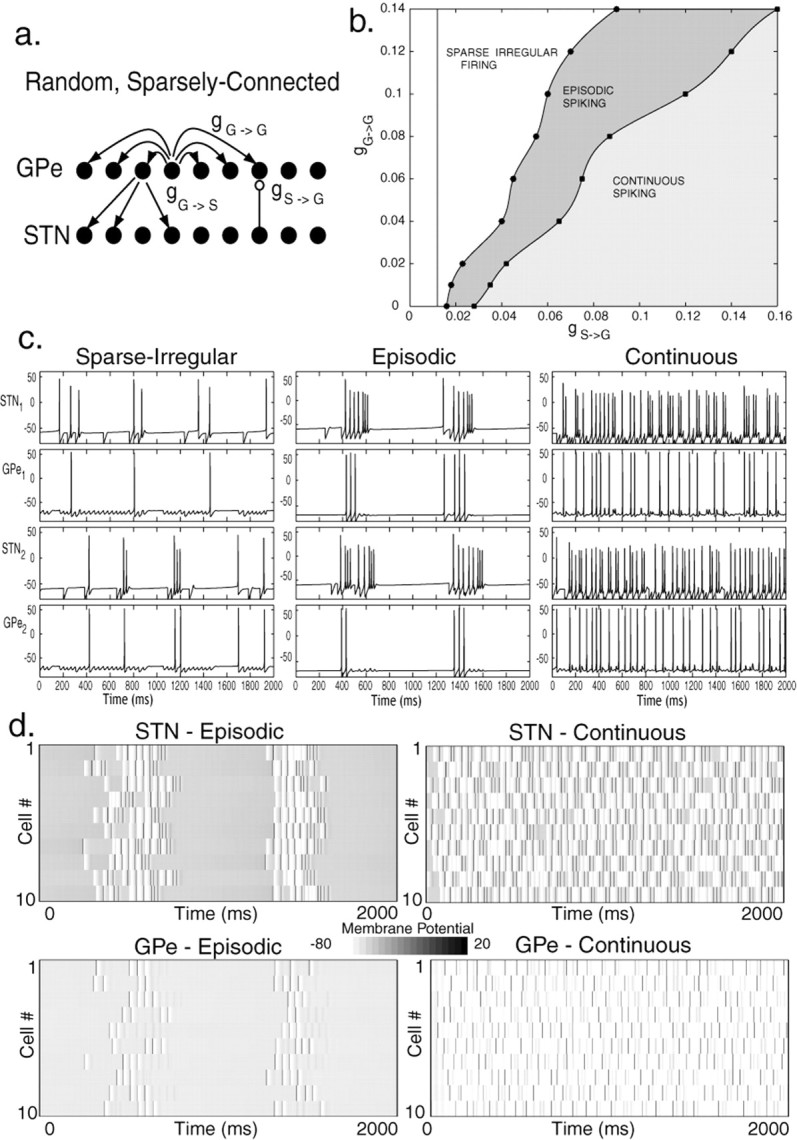
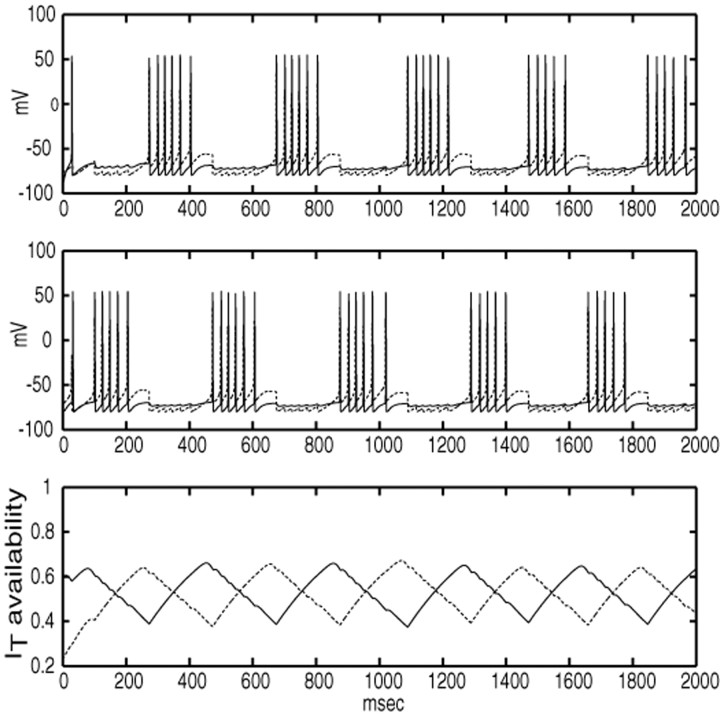
Based on recent experimental data, we have developed a conductance-based computational network model of the subthalamic nucleus and the external segment of the globus pallidus in the indirect pathway of the basal ganglia. Computer simulations and analysis of this model illuminate the roles of the coupling architecture of the network, and associated synaptic conductances, in modulating the activity patterns displayed by this network. Depending on the relationships of these coupling parameters, the network can support three general classes of sustained firing patterns: clustering, propagating waves, and repetitive spiking that may show little regularity or correlation. Each activity pattern can occur continuously or in discrete episodes. We characterize the mechanisms underlying these rhythms, as well as the influence of parameters on details such as spiking frequency and wave speed. These results suggest that the subthalamopallidal circuit is capable both of correlated rhythmic activity and of irregular autonomous patterns of activity that block rhythmicity. Increased striatal input to, and weakened intrapallidal inhibition within, the indirect pathway can switch the behavior of the circuit from irregular to rhythmic. This may be sufficient to explain the emergence of correlated oscillatory activity in the subthalamopallidal circuit after destruction of dopaminergic neurons in Parkinson's disease and in animal models of parkinsonism.


Figures

Fig. 1.
Fig. 1.
Properties of STN model neuron. a, Current as a function of voltage. For fixed voltages, steady-state currents were computed with slow gating variables set to their limiting values [X → X(v); see Materials and Methods]. In this and all subsequent figures, omitted units are as in Tables 1 and 2. b, Membrane potential of a model STN cell under various current injections. The parameter gNa has been set to 0 to mimic the behavior of an STN cell in the presence of sufficient concentration of TTX to block spiking. c, Spike frequency as a function of injected current (solid line, full model; dotted line, gAHP = 0; dashed line, gCa = gT = 0). d, Duration of afterhyperpolarization after high-frequency spiking. A constant current pulse was applied to a model STN cell for 500 msec. After this, a prolonged afterhyperpolarization occurred before the cell returned to regular spiking. Its duration is plotted against the strength of applied current. e, f, STN rebound bursts after hyperpolarizing injections. e, Model responses of STN cell to currents of varying duration: 25 pA/μm2 of current applied for 300 (top), 450 (middle), and 600 (bottom) msec. Longer current application augments deinactivation of IT, enhancing rebound. f, Responses to currents of varying magnitude: 20 (top), 30 (middle), and 40 (bottom) pA/μm2 of current applied for 300 msec. Stronger current application augments deinactivation of IT, enhancing rebound.
Fig. 2.
Fig. 2.
Properties of GPe model neuron. a, Top three time traces show firing profiles of a model GPe cell under depolarizing, zero, and small hyperpolarizing input currents (Iapp in pA/μm2), respectively. Bottom trace shows afterhyperpolarization of a model GPe cell after injection of a depolarizing current pulse. b, Membrane potential of a model GPe cell as a function of injected current, with gNa = 0. c, Frequency of GPe spiking as a function of injected current.
Fig. 3.
Fig. 3.
Activity patterns in a random, sparsely connected architecture. a, Arrangement of the model network. Each STN neuron excites a single GPe neuron selected at random, and each GPe neuron inhibits three randomly chosen STN cells. GPe cells also inhibit each other through all-to-all connections. b, Dependence of activity patterns on coupling strengths gG→Gand gS→G. Weak STN→GPe excitation or strong GPe→GPe inhibition leads to sparse irregular firing patterns. Intermediate values yield episodic patterns, whereas high levels of excitation and low levels of GPe mutual inhibition give rise to continuous uncorrelated activity. c, Membrane potential (in millivolts) as a function of time (milliseconds) for individual cells in each of the activity patterns: sparse activity (gG→G = 0.06 nS/μm2; gS→G = 0.03 nS/μm2; gG→S = 2.5 nS/μm2; Iapp = −1.2 pA/μm2), episodic, almost-synchronized spiking (gG→G = 0 nS/μm2; gS→G = 0.016 nS/μm2; gG→S = 2.5 nS/μm2; Iapp = −1.2 pA/μm2), and continuous, irregular spiking (gG→G = 0.02 nS/μm2; gS→G = 0.1 nS/μm2; gG→S = 2.5 nS/μm2; Iapp = −1.2 pA/μm2). d, Network activity in various patterns. In each plot, 10 rows show the voltage traces of 10 cells, with time evolving over 2000 msec to the right along each row. Voltage is coded in grayscale as shown. Because they are so brief, individual action potentials (dark gray line segments) are not prominent, but are more clearly indicated by their afterhyperpolarization (white bars).
Fig. 4.
Fig. 4.
Mechanisms underlying episodic activity patterns. The gray trace in the top box shows the evolution of voltage over time for a single GPe cell in an episodic pattern, whereas the black trace shows the voltage for a single STN cell. The boxes below show the intracellular calcium concentration of each cell as a function of time. Initially, GPe spikes closely follow STN spikes. Here Iapp is sufficiently strong such that the build-up of calcium terminates the GPe activity of the cell eventually, after which the STN cell fires one last volley of rebound spikes until about 2600 msec. Subsequent decay of calcium allows STN activity to resume after time 3200 msec; this recruits the GPe cell again.
Fig. 5.
Fig. 5.
Activity patterns in a structured, sparsely connected architecture. For all simulations in this Figure, vG→G = −85 mV and β = 0.04 msec−1 for the GPe cells. a, Arrangement of the model network. Each GPe neuron inhibits its two immediate GPe neighbors; it also inhibits two STN neurons, skipping the three located nearest to it. Each STN cell sends excitation only to the nearest, in register GPe cell. Spatially periodic boundary conditions were imposed. b, Dependence of activity patterns on coupling strengths gG→G and gS→G when gG→S = 4.5 nS/μm2and Iapp = −1.0 pA/μm2. The parameter regime and initial conditions used favor formation of clusters rather than waves. Increases in gS→G lead to continuous activity; increases in gG→G weaken activity. c, Voltage (in millivolts) as a function of time (in milliseconds) for individual cells in the three clustered activity patterns: weak and irregular clustered activity (gG→G = 0.06 nS/μm2; gS→G = 0.2 nS/μm2; gG→S = 4.5 nS/μm2; Iapp = −1.0 pA/μm2), episodic clustered oscillations (gG→G = 0.06 nS/μm2; gS→G = 0.56 nS/μm2; gG→S = 4.5 nS/μm2; Iapp = −1.0 pA/μm2), and continuous clustering (gG→G = 0.06 nS/μm2; gS→G = 0.72 nS/μm2; gG→S = 4.5 nS/μm2; Iapp = −1.0 pA/μm2). d, Network activity in various patterns, as in Figure3d but with eight rows shown.
Fig. 6.
Fig. 6.
Mechanisms underlying clustered activity patterns. The top box shows the superimposed voltage time courses for an STN cell (dotted trace) and a GPe cell (solid trace) from a single, tightly synchronized pair belonging to the same cluster in a clustered rhythm; the middle box shows the same for a single pair from a different cluster. The bottom box shows the availability level of the ITcurrents for the STN cells in the two different pairs (solid curve corresponds to middle box; dashed curve to top box). When availability of IT becomes sufficiently large, the suppressed cluster is able to escape and fire; this then suppresses the previously active cluster.
Fig. 7.
Fig. 7.
Activity patterns in the structured, tightly connected architecture. a, Network used for these simulations. Each GPe neuron contacts the five closest STN neurons, as well as all of the GPe cells. Each STN cell sends excitation to the three closest GPe cells. Spatially periodic boundary conditions were imposed. b, Dependence of activity patterns on coupling strengths gG→G and gS→G when gG→S = 1.0 nS/μm2 and Iapp = −1.2 pA/μm2. Increases in gS→G lead to continuous activity; increases in gG→G yield a transition to waves followed by sparse, irregular firing. The value of gG→G at which each of these transitions occurs rises with gS→G. c, Voltage (in millivolts) as a function of time (in milliseconds) for individual cells in various activity patterns: episodic, almost-synchronized spiking (gG→G = 0.0 nS/μm2; gS→G = 0.013 nS/μm2; gG→S = 1.0 nS/μm2; Iapp = −1.2 pA/μm2for GPe), episodic wave (gG→G = 0.02 nS/μm2; gS→G = 0.013 nS/μm2; gG→S = 1.0 nS/μm2; Iapp = −1.2 pA/μm2), and continuous wave (gG→G = 0.1 nS/μm2; gS→G = 0.03 nS/μm2; gG→S = 1.0 nS/μm2; Iapp = −1.2 pA/μm2). d, Network activity in various patterns, featuring STN cells during episodic spiking, episodic wave, continuous wave, and sparse irregular spiking (gG→G = 0.23 nS/μm2; gS→G = 0.03 nS/μm2; gG→S = 1.0 nS/μm2; Iapp = −1.2 pA/μm2). The GPe cells exhibit voltage patterns very similar to the STN cells.
Fig. 8.
Fig. 8.
Schematic diagram of the indirect pathway connections in the basal ganglia in normal (left column) and parkinsonian (right column) states. Minus symbolsdenote inhibitory connections; plus symbols denote excitatory ones. In the parkinsonian regime, the combination of weakened intra-GPe connections and strengthened striatal input set the stage for synchronous GPe-STN oscillations and correlated rhythmic STN output.

References

    1. Albin RL, Young AB, Penney JB. The functional anatomy of basal ganglia disorders. Trends Neurosci. 1989;12:366–375. - PubMed
    1. Baranauskas G, Thatch T, Surmeier DJ. Delayed rectifier currents in rat globus pallidus neurons are attributable to Kv2.1 and Kv3.1/3.2 K(+) channels. J Neurosci. 1999;19:6394–6404. - PMC - PubMed
    1. Ben-Paz H, Bergman H, Goldberg JA, Giladi N, Hansel D, Reches A, Simon ES. Synchrony of rest tremor in multiple limbs in parkinson's disease: evidence for multiple oscillators. J Neural Transm. 2001;108:287–296. - PubMed
    1. Bergman H, Wichmann T, Karmon B, DeLong MR. The primate subthalamic nucleus. II. Neuronal activity in the MPTP model of parkinsonism. J Neurophysiol. 1994;72:507–520. - PubMed
    1. Bergman H, Raz A, Feingold A, Nini A, Nelken I, Hansel D, Ben-Paz H, Reches A. Physiology of MPTP tremor. Mov Disord. 1998;13:29–34. - PubMed

Publication types

LinkOut - more resources