. 2002 Apr;20(4):359-65.
doi: 10.1038/nbt0402-359.

Multiplexed protein profiling on microarrays by rolling-circle amplification

Affiliations

Multiplexed protein profiling on microarrays by rolling-circle amplification

Barry Schweitzer et al. Nat Biotechnol. 2002 Apr.

Abstract

Fluorescent-sandwich immunoassays on microarrays hold appeal for proteomics studies, because equipment and antibodies are readily available, and assays are simple, scalable, and reproducible. The achievement of adequate sensitivity and specificity, however, requires a general method of immunoassay amplification. We describe coupling of isothermal rolling-circle amplification (RCA) to universal antibodies for this purpose. A total of 75 cytokines were measured simultaneously on glass arrays with signal amplification by RCA with high specificity, femtomolar sensitivity, 3 log quantitative range, and economy of sample consumption. A 51-feature RCA cytokine glass array was used to measure secretion from human dendritic cells (DCs) induced by lipopolysaccharide (LPS) or tumor necrosis factor-alpha (TNF-alpha). As expected, LPS induced rapid secretion of inflammatory cytokines such as macrophage inflammatory protein (MIP)-1beta, interleukin (IL)-8, and interferon-inducible protein (IP)-10. We found that eotaxin-2 and I-309 were induced by LPS; in addition, macrophage-derived chemokine (MDC), thymus and activation-regulated chemokine (TARC), soluble interleukin 6 receptor (sIL-6R), and soluble tumor necrosis factor receptor I (sTNF-RI) were induced by TNF-alpha treatment. Because microarrays can accommodate approximately 1,000 sandwich immunoassays of this type, a relatively small number of RCA microarrays seem to offer a tractable approach for proteomic surveys.


Figures
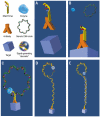
Figure 1
Figure 1
Schematic representation of immunoassays with RCA signal amplification. (A) In the adaptation of RCA used for protein signal amplification, the 5′ end of an oligonucleotide primer is attached to an antibody. (B) The antibody–DNA conjugate binds to its specific target molecule; in the multiplexed microarray immunoassay, the targets are biotinylated secondary antibodies and the conjugate is an anti-biotin antibody. (C) A circular DNA molecule hybridizes to its complementary primer on the conjugate, and in the presence of DNA polymerase and nucleotides, rolling-circle replication occurs. (D) A long single DNA molecule that represents a concatamer of complements of the circle DNA sequence is generated that remains attached to the antibody. (E) This RCA product is detected by hybridization of multiple fluorescent, complementary oligonucleotide probes. RCA product fluorescence is measured with a conventional microarray scanning device. The amount of fluorescence at each spot is directly proportional to the amount of specific protein in the original sample.
Figure 2
Figure 2
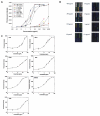
Sensitivity of cytokine detection by RCA and direct detection. (A) Serial dilutions of individual cytokines were incubated on duplicate subarrays. On one set of subarrays, detection was carried out using RCA signal amplification. On the second set of subarrays, “direct” detection was performed using Cy5-labeled streptavidin. Fluorescence intensity of each spot was measured with a microarray scanner, and averages of the eight replicates of each antibody were plotted. (B) Seven cytokines were mixed, serially diluted, and incubated on subarrays containing monoclonal antibodies spotted in quadruplicate columns. Shown are fluorescence images of subarrays obtained with a microarray scanner. Top row of quadruplicate columns, left to right: MIP-1β, TARC, MCP-1, RANTES; bottom row of quadruplicate columns, left to right: sIL-6R, MDC, I-309, biotin-mIgG (positive control). (C) Indicated on each graph are mean fluorescence intensities and standard deviations derived from two subarrays, with four spots per subarray.
Figure 3
Figure 3
Kinetics of cytokine production in maturing LCs on microarrays. Cytokine levels present in LC culture supernatants at six time points without induction or after LPS or TNF-α stimulation were determined by microarray immunoassay. Fluorescence intensities were converted to pg/ml using standard curves generated from mixtures of purified cytokines serially diluted in X-VIVO culture medium. The data for IL-8, MDC, TARC, and sIL-6R were generated from experiments using 1:20 dilutions of culture supernatants, and were corrected for this dilution factor. Black circles, LPS-treated; red triangles, TNF-α; green squares, uninduced.
Figure 4
Figure 4
Cytokines with at least fourfold increased abundance during 72 h culture with or without LPS or TNF-α.
Figure 5
Figure 5
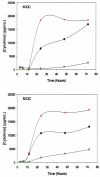
Comparison of MDC measurement in supernatants by commercial ELISA and multiplexed RCA-amplified microarray immunoassay. MDC levels present in LC culture supernatants at six time points without induction or after LPS or TNF-α stimulation were determined by RCA microarray immunoassay (above) or commercial ELISA (below). Fluorescence intensities of the RCA microarray immunoassay were converted to pg/ml using standard curves generated from mixtures of purified cytokines. Black circles, LPS-treated; red triangles, TNF-α; green squares, uninduced.

References

    1. Bussow K, et al. A method for global protein expression and antibody screening on high-density filters of an arrayed cDNA library. Nucleic Acids Res. 1998;26:5007–5008. - PMC - PubMed
    1. Leuking A, et al. Protein microarrays for gene expression and antibody screening. Anal. Biochem. 1999;270:103–111. - PubMed
    1. Ge H. UPA, a universal protein array system for quantitative detection of protein–protein, protein–DNA, protein–RNA and protein–ligand interactions. Nucleic Acids Res. 2000;28:e3. - PMC - PubMed
    1. de Wildt RMT, Mundy CR, Gorick BD, Tomlinson IM. Antibody arrays for high-throughput screening of antibody–antigen interactions. Nat. Biotechnol. 2000;18:989–994. - PubMed
    1. MacBeath G, Schreiber SL. Printing proteins as microarrays for high-through-put function determination. Science. 2000;289:1760–1763. - PubMed

MeSH terms