

A genomewide linkage scan for quantitative-trait loci for obesity phenotypes
- PMID: 11923910
- PMCID: PMC447591
- DOI: 10.1086/339934
A genomewide linkage scan for quantitative-trait loci for obesity phenotypes
Abstract
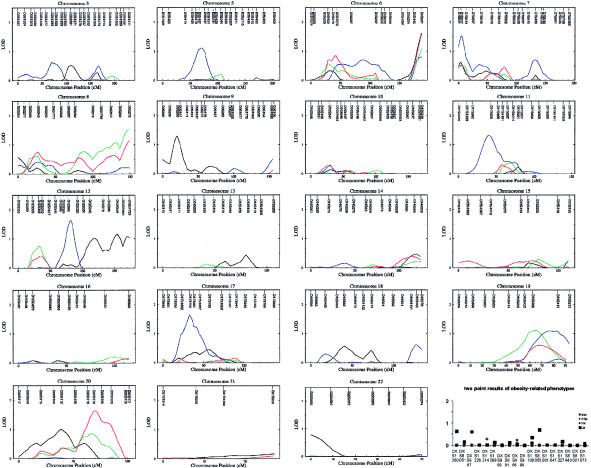
Obesity is an increasingly serious health problem in the world. Body mass index (BMI), percentage fat mass, and body fat mass are important indices of obesity. For a sample of pedigrees that contains >10,000 relative pairs (including 1,249 sib pairs) that are useful for linkage analyses, we performed a whole-genome linkage scan, using 380 microsatellite markers to identify genomic regions that may contain quantitative-trait loci (QTLs) for obesity. Each pedigree was ascertained through a proband who has extremely low bone mass, which translates into a low BMI. A major QTL for BMI was identified on 2q14 near the marker D2S347 with a LOD score of 4.04 in two-point analysis and a maximum LOD score (MLS) of 4.44 in multipoint analysis. The genomic region near 2q14 also achieved an MLS >2.0 for percentage of fat mass and body fat mass. For the putative QTL on 2q14, as much as 28.2% of BMI variation (after adjustment for age and sex) may be attributable to this locus. In addition, several other genomic regions that may contain obesity-related QTLs are suggested. For example, 1p36 near the marker D1S468 may contain a QTL for BMI variation, with a LOD score of 2.75 in two-point analysis and an MLS of 2.09 in multipoint analysis. The genomic regions identified in this and earlier reports are compared for further exploration in extension studies that use larger samples and/or denser markers for confirmation and fine-mapping studies, to eventually identify major functional genes involved in obesity.
Figures

References
Electronic-Database Information
-
- Center for Medical Genetics, Marshfield Medical Research Foundation, http://research.marshfieldclinic.org/genetics/
-
- Division of Statistical Genetics, http://watson.hgen.pitt.edu/register/soft_doc.html (for PedCheck)
-
- Online Mendelian Inheritance in Man (OMIM), http://www.ncbi.nlm.nih.gov/Omim/
References
-
- Allison DB, Kaprio J, Korkelia M, Koskenvuo M, Neale MC, Hayakawa K (1996) The heritability of body mass index among an international sample of monozygotic twins reared apart. Int J Obes Relat Metab Disord 20:501–506 - PubMed
-
- Allison DB, Saunders ES (2000) Obesity in North America. Med Clin North Am 84:305–332 - PubMed
Publication types
MeSH terms
Grants and funding
LinkOut - more resources
Full Text Sources
Other Literature Sources
Medical
