. 2002 Apr 1;157(1):137-48.
doi: 10.1083/jcb.200108071. Epub 2002 Apr 1.

Muscle-specific expression of insulin-like growth factor I counters muscle decline in mdx mice

Affiliations

Muscle-specific expression of insulin-like growth factor I counters muscle decline in mdx mice

Elisabeth R Barton et al. J Cell Biol. .

Abstract

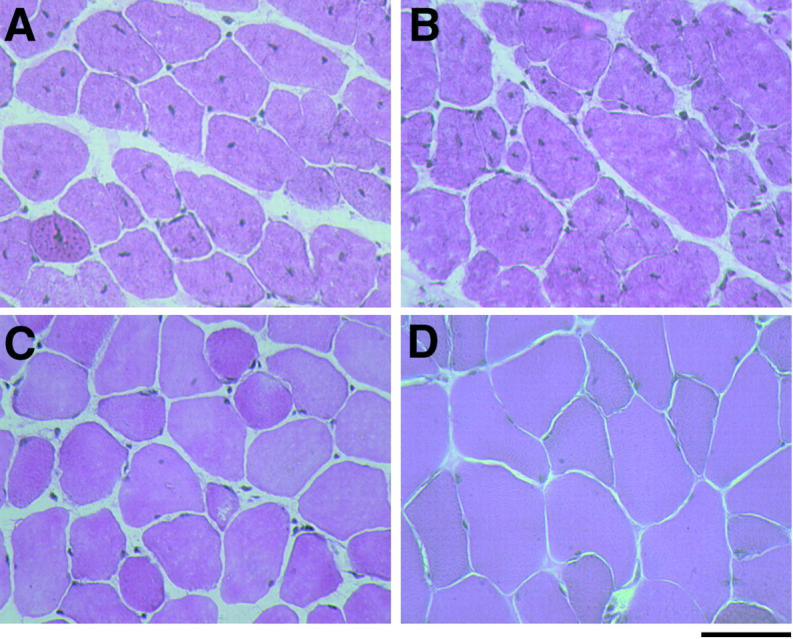
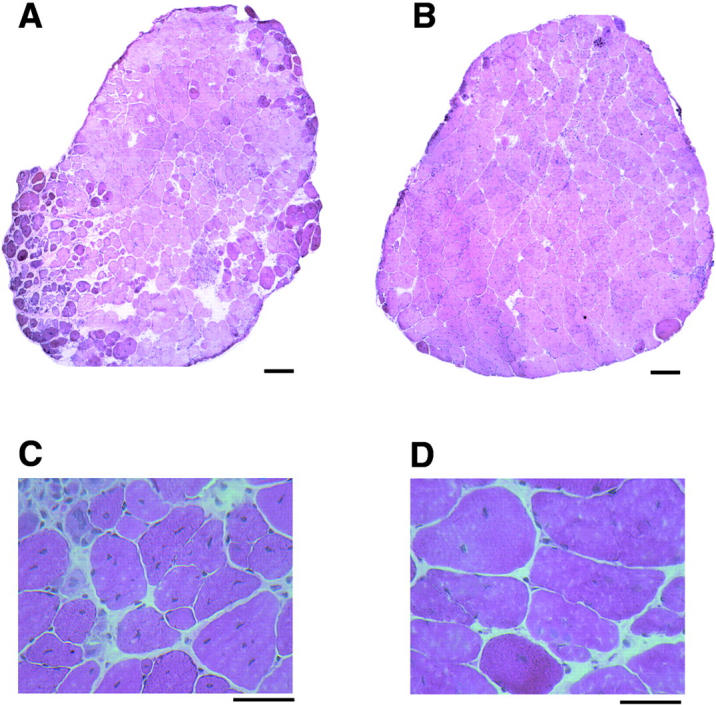
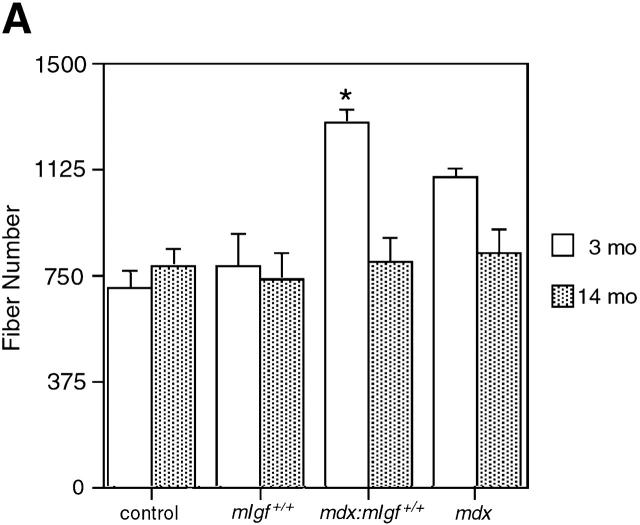
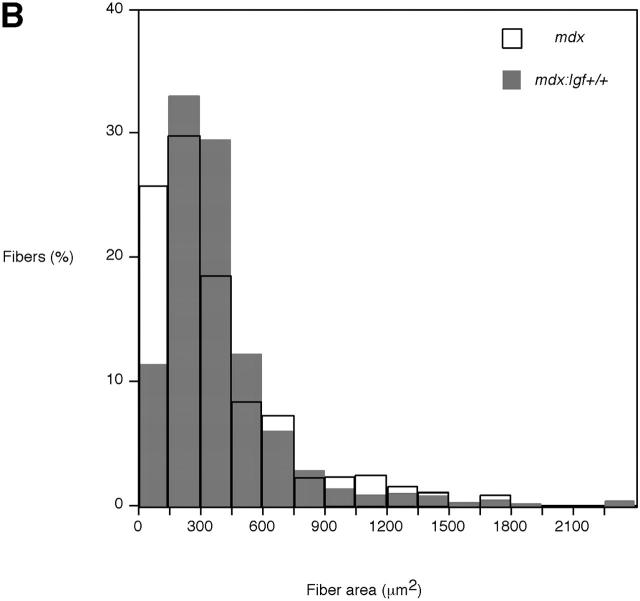
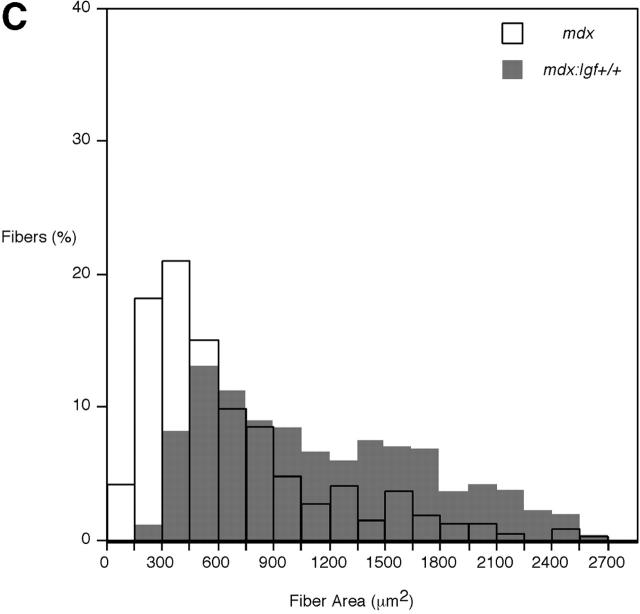
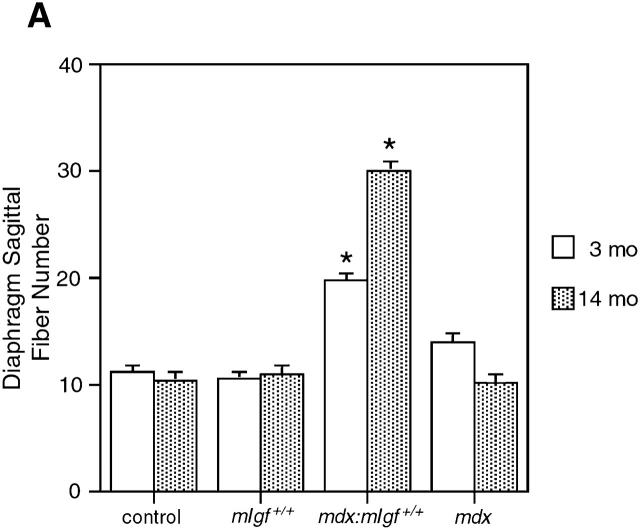
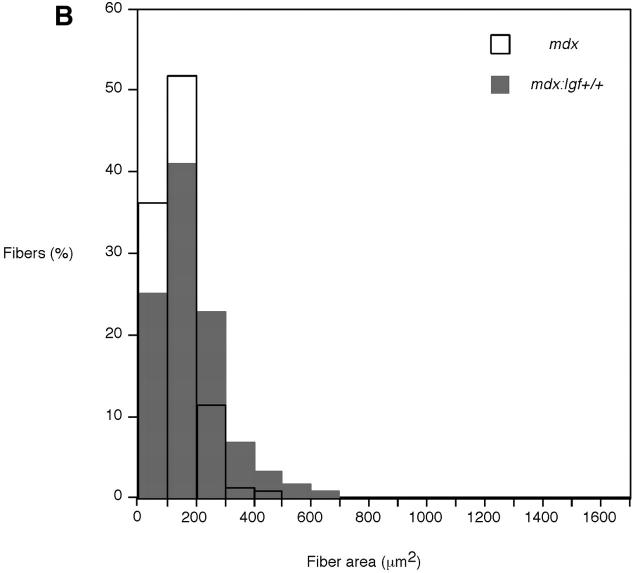
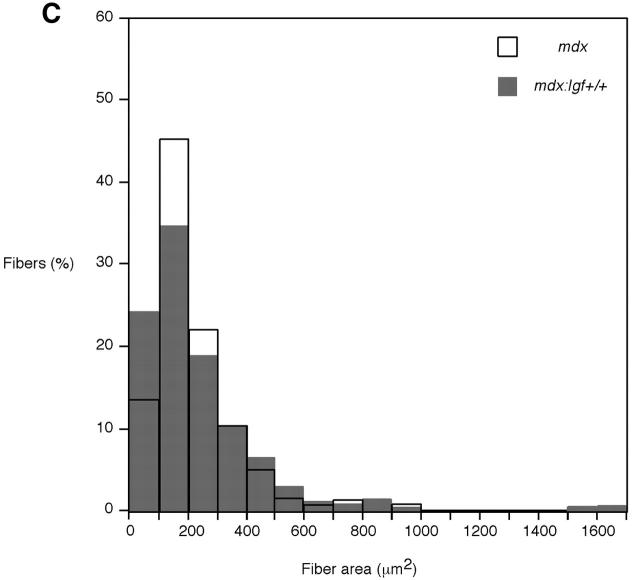
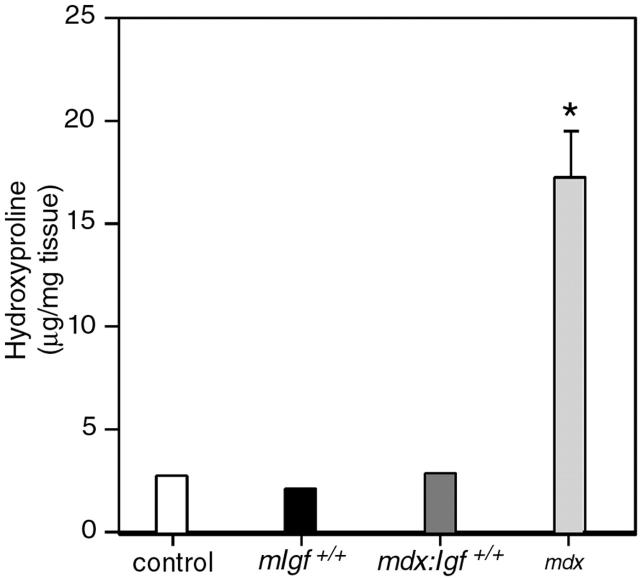
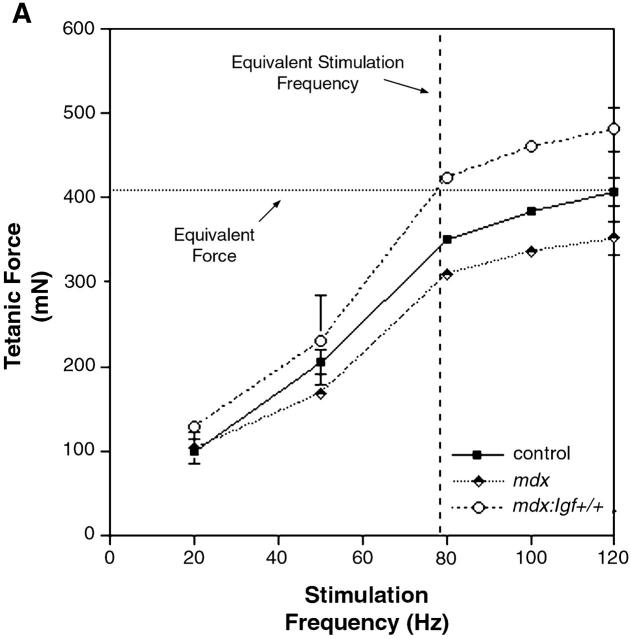
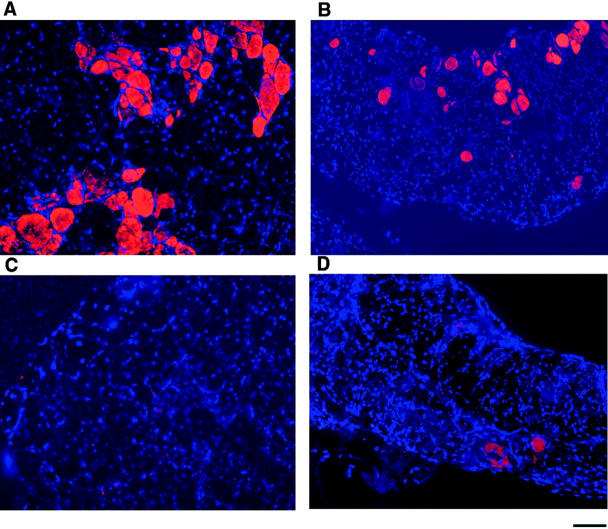
Duchenne muscular dystrophy is an X-linked degenerative disorder of muscle caused by the absence of the protein dystrophin. A major consequence of muscular dystrophy is that the normal regenerative capacity of skeletal muscle cannot compensate for increased susceptibility to damage, leading to repetitive cycles of degeneration-regeneration and ultimately resulting in the replacement of muscle fibers with fibrotic tissue. Because insulin-like growth factor I (IGF-I) has been shown to enhance muscle regeneration and protein synthetic pathways, we asked whether high levels of muscle-specific expression of IGF-I in mdx muscle could preserve muscle function in the diseased state. In transgenic mdx mice expressing mIgf-I (mdx:mIgf+/+), we showed that muscle mass increased by at least 40% leading to similar increases in force generation in extensor digitorum longus muscles compared with those from mdx mice. Diaphragms of transgenic mdx:mIgf+/+ exhibited significant hypertrophy and hyperplasia at all ages observed. Furthermore, the IGF-I expression significantly reduced the amount of fibrosis normally observed in diaphragms from aged mdx mice. Decreased myonecrosis was also observed in diaphragms and quadriceps from mdx:mIgf+/+ mice when compared with age-matched mdx animals. Finally, signaling pathways associated with muscle regeneration and protection against apoptosis were significantly elevated. These results suggest that a combination of promoting muscle regenerative capacity and preventing muscle necrosis could be an effective treatment for the secondary symptoms caused by the primary loss of dystrophin.


Figures

Figure 1.
Figure 1.
Hemotoxilin and eosin histology of young (3 mo) EDLs. Images reveal the fiber hypertrophy in both mIgf +/+ strains, and that central nuclei remain in mdx:mIgf +/+ in similar proportions to mdx muscle. (A) mdx; (B) mdx:mIgf +/+ ; (C) control; (D) mIgf +/+. Bar, 50 μm.
Figure 2.
Figure 2.
Hemotoxilin and easin histology of aged (14 mo) EDLs. mdx (A and C) and mdx:mIgf +/+ (B and D) mice. Igf-I expression preserves mdx muscle homogeneity and promotes muscle hypertrophy. Bars: (A and B) 100 μm; (C and D) 50 μm.
Figure 3.
Figure 3.
Fiber analysis of EDL muscles. (A) The number of fibers in the midbelly cross section of young EDL muscles was significantly higher in mdx:mIgf +/+ muscles compared with mdx muscles. By 14 mo of age, however, the difference in fiber number disappeared. (B) Fiber size distribution in young EDL muscles. There was a rightward shift indicative of an increase in fiber area in young mdx:mIgf +/+ muscles compared with mdx muscles. (C) Fiber size distribution in aged EDL muscles. The increase in fiber area was also observed in EDL muscles from 14-mo-old mdx:mIgf +/+ animals. However, the distribution of fiber sizes in older muscles from both strains was significantly wider compared with younger muscles. (D) Fiber type distribution of mdx and mdx:mIgf +/+ EDL muscles. Young EDL muscles displayed no shift in fiber type composition with IGF-I expression. However, the decline in the IIb fiber population associated with older mdx EDLs was prevented in EDLs from mdx:mIgf +/+ mice. *, statistically significant from young mdx EDL, P < 0.05.
Figure 3.
Figure 3.
Fiber analysis of EDL muscles. (A) The number of fibers in the midbelly cross section of young EDL muscles was significantly higher in mdx:mIgf +/+ muscles compared with mdx muscles. By 14 mo of age, however, the difference in fiber number disappeared. (B) Fiber size distribution in young EDL muscles. There was a rightward shift indicative of an increase in fiber area in young mdx:mIgf +/+ muscles compared with mdx muscles. (C) Fiber size distribution in aged EDL muscles. The increase in fiber area was also observed in EDL muscles from 14-mo-old mdx:mIgf +/+ animals. However, the distribution of fiber sizes in older muscles from both strains was significantly wider compared with younger muscles. (D) Fiber type distribution of mdx and mdx:mIgf +/+ EDL muscles. Young EDL muscles displayed no shift in fiber type composition with IGF-I expression. However, the decline in the IIb fiber population associated with older mdx EDLs was prevented in EDLs from mdx:mIgf +/+ mice. *, statistically significant from young mdx EDL, P < 0.05.
Figure 4.
Figure 4.
Histology of young diaphragms from control, mIgf +/+ , mdx, and mdx:mIgf +/+ mice. Diaphragms from 3-mo-old mdx:mIgf +/+ animals (D) were ∼60% thicker than age-matched mdx control diaphragms (B). There was modest hypertrophy in young mIgf +/+ diaphragms (C) compared with controls (A), but due only to increased fiber size not to an increase in fiber number.
Figure 5.
Figure 5.
Fiber analysis of diaphragms. (A) The number of fibers across the sagittal plane of the mdx:mIgf +/+ diaphragm was almost double that of other strains at 3 mo of age, and by 14 mo, there were approximately three times as many fibers when compared with age-matched diaphragms from the other mouse strains. (B) Fiber size increased in young mdx:mIgf +/+ diaphragms as the proportion of larger fibers was greater than in mdx diaphragms. (C) By 14 mo, there was a leftward shift in fiber size distribution in the mdx:mIgf +/+ diaphragms. Thus, the increased thickness of young mdx:mIgf +/+ diaphragms was due to a combination of hyperplasia and fiber hypertrophy, whereas the increased size of aged mdx:mIgf +/+ diaphragms was due primarily to hyperplasia. *, statistically significant from mdx diaphragm, P < 0.05.
Figure 5.
Figure 5.
Fiber analysis of diaphragms. (A) The number of fibers across the sagittal plane of the mdx:mIgf +/+ diaphragm was almost double that of other strains at 3 mo of age, and by 14 mo, there were approximately three times as many fibers when compared with age-matched diaphragms from the other mouse strains. (B) Fiber size increased in young mdx:mIgf +/+ diaphragms as the proportion of larger fibers was greater than in mdx diaphragms. (C) By 14 mo, there was a leftward shift in fiber size distribution in the mdx:mIgf +/+ diaphragms. Thus, the increased thickness of young mdx:mIgf +/+ diaphragms was due to a combination of hyperplasia and fiber hypertrophy, whereas the increased size of aged mdx:mIgf +/+ diaphragms was due primarily to hyperplasia. *, statistically significant from mdx diaphragm, P < 0.05.
Figure 6.
Figure 6.
Histology of aged (14 mo) diaphragms. In 14-mo-old animals, the hypertrophic response continued; the thickness of mdx:mIgf +/+ diaphragms (B) were triple that of mdx controls (A). Gomori's trichrome staining (C and D) revealed a reduction in connective tissue in mdx:mIgf +/+ diaphragms (D) compared with those from mdx controls (C). Bars, 50 μm.
Figure 7.
Figure 7.
Hydroxyproline content of aged diaphragm muscles. Hydroxyproline levels, an index of fibrosis, were reduced in 14-mo-old mdx:mIgf +/+ diaphragms to normal levels found in age-matched mIgf +/+ and control muscles. Measurements were performed in duplicate on n = 2 muscle samples from each mouse strain. *, statistically significant (P < 0.05) from age-matched control diaphragm.
Figure 8.
Figure 8.
Functional assessment of EDLs from mdx and mdx:mIgf +/+ mice. (A) Force frequency relationship of EDL muscles. The maximum force generated by control and mdx EDLs at 120 Hz is comparable to the force generated in mdx:mIgf +/+ muscles stimulated at ∼70–80 Hz (dotted line). Eccentric contractions were performed at equivalent forces (mdx:mIgf +/+ at 80 Hz vs. mdx and control at 120 Hz) and at equivalent stimulation frequencies (dashed line, 80 Hz for all strains). (B) Damage associated with eccentric contractions in mdx, mdx:mIgf +/+, and control EDLs. (B, left) EDL muscles were subjected to five eccentric contractions with a 10% Lo stretch during stimulation at 80 Hz. The decrement of force between the first and last contraction is not significantly different between mdx and mdx:mIgf +/+ muscle at this stimulation frequency (34.5 ± 9.8% vs. 37.3 ± 8.7% for mdx and mdx: mIgf +/+, respectively), and both are more susceptible to damage than control muscles. (B, right) When muscles were subjected to eccentric contractions at equivalent force, mdx muscles experienced significantly greater drops in force (37.3 ± 8.7% for mdx:mIgf +/+ at 80 Hz vs. 64.3 ± 3.4% for mdx at 120 Hz, P < 0.05). Control muscles were not susceptible to contraction-induced injury at 120-Hz stimulation frequency. *, statistically significant (P < 0.05) from age-matched mdx muscles.
Figure 8.
Figure 8.
Functional assessment of EDLs from mdx and mdx:mIgf +/+ mice. (A) Force frequency relationship of EDL muscles. The maximum force generated by control and mdx EDLs at 120 Hz is comparable to the force generated in mdx:mIgf +/+ muscles stimulated at ∼70–80 Hz (dotted line). Eccentric contractions were performed at equivalent forces (mdx:mIgf +/+ at 80 Hz vs. mdx and control at 120 Hz) and at equivalent stimulation frequencies (dashed line, 80 Hz for all strains). (B) Damage associated with eccentric contractions in mdx, mdx:mIgf +/+, and control EDLs. (B, left) EDL muscles were subjected to five eccentric contractions with a 10% Lo stretch during stimulation at 80 Hz. The decrement of force between the first and last contraction is not significantly different between mdx and mdx:mIgf +/+ muscle at this stimulation frequency (34.5 ± 9.8% vs. 37.3 ± 8.7% for mdx and mdx: mIgf +/+, respectively), and both are more susceptible to damage than control muscles. (B, right) When muscles were subjected to eccentric contractions at equivalent force, mdx muscles experienced significantly greater drops in force (37.3 ± 8.7% for mdx:mIgf +/+ at 80 Hz vs. 64.3 ± 3.4% for mdx at 120 Hz, P < 0.05). Control muscles were not susceptible to contraction-induced injury at 120-Hz stimulation frequency. *, statistically significant (P < 0.05) from age-matched mdx muscles.
Figure 9.
Figure 9.
Evan's blue staining on cryosections from young (3 mo) mdx and mdx:mIgf +/+ muscles. 10-μm cryosections from mdx (A and B) and mdx:mIgf +/+ (C and D) mice. Quadriceps (A and C) and diaphragms (B and D). Bar, 100 μm.
Figure 10.
Figure 10.
Immunoblot analysis of total Akt, P-Akt, and α-tubulin in quadriceps muscles from 3-mo-old control (wt), mIgf +/+ , mdx, and mdx:mIgf +/+ mice. Akt phosphorylation of both serine 473 and threonine 308 was significantly amplified in mdx:mIgf +/+ muscle, without a commensurate change in total Akt levels compared with muscles from mIgf +/+ and mdx strains. Immunoblotting for α-tubulin served as a control for protein loading.

References

    1. Adams, G.R., and S.A. McCue. 1998. Localized infusion of IGF-I results in skeletal muscle hypertrophy in rats. J. Appl. Physiol. 84:1716–1722. - PubMed
    1. Alessi, D.R., and P. Cohen. 1998. Mechanism of activation and function of protein kinase B. Curr. Opin. Genet. Dev. 8:55–62. - PubMed
    1. Allen, R.E., S.M. Sheehan, R.G. Taylor, T.L. Kendall, and G.M. Rice. 1995. Hepatocyte growth factor activates quiescent skeletal muscle satellite cells in vitro. J. Cell. Physiol. 165:307–312. - PubMed
    1. Anderson, J.E., W.K. Ovalle, and B.H. Bressler. 1987. Electron microscopic and autoradiographic characterization of hindlimb muscle regeneration in the mdx mouse. Anat. Rec. 219:243–257. - PubMed
    1. Barton-Davis, E.R., D.I. Shoturma, A. Musaro, N. Rosenthal, and H.L. Sweeney. 1998. Viral mediated expression of insulin-like growth factor I blocks the aging-related loss of skeletal muscle function. Proc. Natl. Acad. Sci. USA. 95:15603–15607. - PMC - PubMed

Publication types

Substances