. 2002 Apr;109(7):915-21.
doi: 10.1172/JCI14588.

Hypothalamic Y2 receptors regulate bone formation

Affiliations

Hypothalamic Y2 receptors regulate bone formation

Paul A Baldock et al. J Clin Invest. 2002 Apr.

Abstract

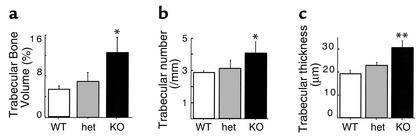
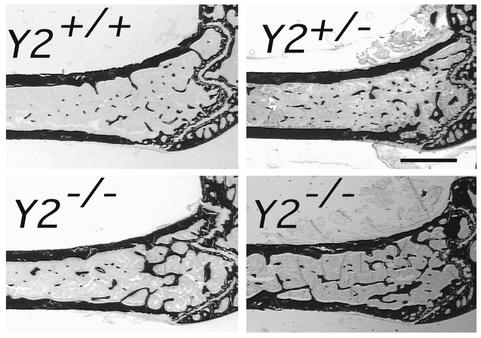
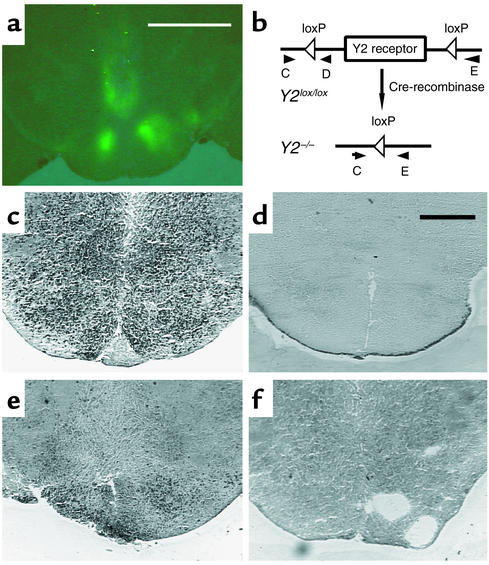
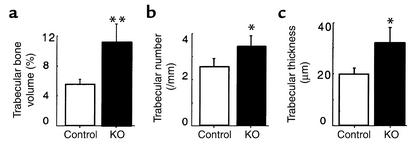
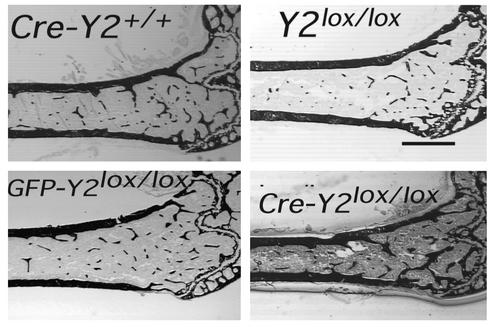
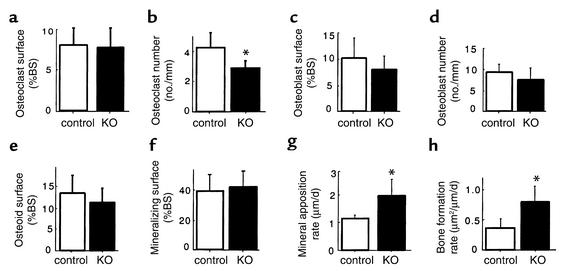
Neuropeptide Y (NPY) is a downstream modulator of leptin action, possibly at the level of the arcuate nucleus where NPY neurons are known to express both leptin receptors and Y2 receptors. In addition to the well-described role of NPY and leptin in energy balance and obesity, intracerebroventricular administration of NPY or leptin also causes bone loss. Here we show that Y2 receptor-deficient mice have a twofold increase in trabecular bone volume as well as greater trabecular number and thickness compared with control mice. We also demonstrate that central Y2 receptors are crucial for this process, since selective deletion of hypothalamic Y2 receptors in mature conditional Y2 knockout mice results in an identical increase in trabecular bone volume within 5 weeks. This hypothalamus-specific Y2 receptor deletion stimulates osteoblast activity and increases the rate of bone mineralization and formation, with no effect on osteoblast or osteoclast surface measurements. The lack of any changes in plasma total calcium, leptinemia, or hypothalamo-pituitary-corticotropic, -thyrotropic, -somatotropic, or -gonadotropic output suggests that Y2 receptors do not modulate bone formation by humoral mechanisms, and that alteration of autonomic function through hypothalamic Y2 receptors may play a key role in a major central regulatory circuit of bone formation.


Figures

Figure 1
Figure 1
Effect of germline Y2 receptor deletion on cortical bone of the distal femur. Cortical area (a) and cortical thickness (b) of the femoral midshaft of male wild-type mice (WT, white bars) compared with those of Y2–/– mice (KO, black bars) at 15–17 weeks of age. Values are mean ± SD of five to eight mice per group.
Figure 2
Figure 2
Sample area for trabecular bone histomorphometry. All trabecular bone bordered distally by the epiphyseal growth plate and extending 4.5 mm proximally was sampled.
Figure 3
Figure 3
Effect of germline Y2 receptor deletion on trabecular bone of the distal femoral metaphysis. Trabecular bone volume (a), trabecular number (b), and trabecular thickness (c) of femora from male wild-type mice (WT, white bars) compared with heterozygous Y2+/– (het, gray bars) and homozygous Y2–/– mice (KO, black bars) at 15–17 weeks of age. Values are mean ± SD of five to eight mice per group. *P < 0.05, **P < 0.01 versus wild-type mice.
Figure 4
Figure 4
Sagittal micrographs of the distal femoral metaphysis of germline Y2–/– male mice at 15–17 weeks of age compared with Y2+/– and wild-type (Y2+/+) control male mice. Figures show darkly stained bone tissue and are representative of the respective groups. Bar represents 1 mm.
Figure 5
Figure 5
Expression of GFP and in situ PCR of the hypothalamus of Cre-adenovirus–injected Y2lox/lox mice and germline Y2–/– mice. (a) Fluorescence micrograph of the hypothalamus of a Y2lox/lox animal 21 days after injection of GFP-expressing adenovirus. Bar represents 2 mm. (b) Schematic drawing of the position of the primers (oligo C, D, and E) used for in situ PCR. (c) In situ PCR on a brain section from a Y2lox/lox animal using oligo C and oligo D. (d) In situ PCR on a brain section from a Y2–/– animal using oligo C and oligo D. (e) In situ PCR on a brain section from a Cre-adenovirus–injected Y2lox/lox animal using oligo C and oligo E. (f) In situ PCR on a brain section from a Cre-adenovirus–injected Y2lox/lox animal using oligo C and oligo E without enzyme. Bar represents 1 mm in cf.
Figure 6
Figure 6
Effect of adult induced hypothalamus-specific Y2 receptor deletion on trabecular bone of the distal femoral metaphysis. Trabecular bone volume (a), trabecular number (b), and trabecular thickness (c) in male Y2+/+ Cre-adeno-virus–injected or Y2lox/lox GFP-adenovirus–injected control mice (white bars) compared with Y2lox/lox Cre-adenovirus–injected mice (KO, black bars) at 15–17 weeks of age. Values are mean ± SD of five to seven mice per group. *P < 0.01, **P < 0.001 versus controls.
Figure 7
Figure 7
Sagittal micrographs of the distal femoral metaphysis of control and hypothalamus-specific Y2 receptor knockout mice: Cre-adenovirus–injected wild-type control (Cre-Y2+/+), Y2lox/lox control, GFP-injected control (GFP-Y2lox/lox), and Cre-injected hypothalamic Y2 receptor knockout (Cre-Y2lox/lox). All mice were males, 15–17 weeks of age. Measurements were taken 5 weeks after hypothalamic injection. Each micrograph is a representative sample. Bar represents 1 mm.
Figure 8
Figure 8
Effect of hypothalamus-specific Y2 receptor deletion on trabecular bone cell activity in the distal femoral metaphysis. Osteoclast surface (a), osteoclast number (b), osteoblast surface (c), osteoblast number (d), osteoid surface (e), mineralizing surface (f), mineral apposition rate (g), and bone formation rate (h) of femurs from male Y2+/+ Cre-adenovirus–injected or Y2lox/lox GFP- adenovirus–injected control mice (white bars) compared with Y2lox/lox Cre-adenovirus–injected knockouts (KO, black bars) at 15–17 weeks of age. Values are mean ± SD of five to seven mice per group. *P < 0.05 versus controls.
Figure 9
Figure 9
Effect of hypothalamus-specific Y2 receptor deletion on bone mineralization in the distal femoral metaphysis. Fluorescence micrographs of male GFP-adenovirus–injected Y2lox/lox control animals compared with Cre-adenovirus–injected Y2lox/lox knockout mice at 15–17 weeks of age, showing the greater distance between the bands in knockout mice. Bar represents 1 mm.

References

    1. Stephens TW, et al. The role of neuropeptide Y in the antiobesity action of the obesegene product. Nature. 1995;377:530–532. - PubMed
    1. Coleman, D.L. 1988. Classical diabetes models: past lessons and potential new therapies. In Frontiers in diabetes research. Lessons from animal diabetes II. E. Shafrir and A.E. Renold, editors. John Libbey & Co. London, United Kingdom. 253–256.
    1. Erickson JC, Hollopeter G, Palmiter RD. Attenuation of the obesity syndrome of ob/ob mice by the loss of neuropeptide Y. Science. 1996;274:1704–1707. - PubMed
    1. Ducy P, et al. Leptin inhibits bone formation through a hypothalamic relay: a central control of bone mass. Cell. 2000;100:197–207. - PubMed
    1. Sainsbury A, Cusin I, Doyle P, Rohner-Jeanrenaud F, Jeanrenaud B. Intracerebroventricular administration of neuropeptide Y to normal rats increases obesegene expression in white adipose tissue. Diabetologia. 1996;39:353–356. - PubMed

Publication types

Substances