. 2002 Apr 1;195(7):869-79.
doi: 10.1084/jem.20011712.

CD1d-restricted human natural killer T cells are highly susceptible to human immunodeficiency virus 1 infection

Affiliations

CD1d-restricted human natural killer T cells are highly susceptible to human immunodeficiency virus 1 infection

Alison Motsinger et al. J Exp Med. .

Abstract

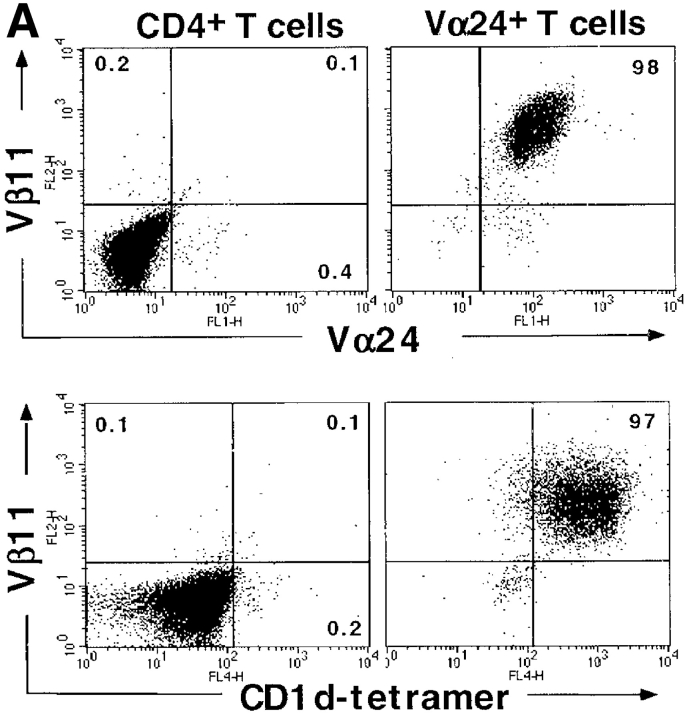
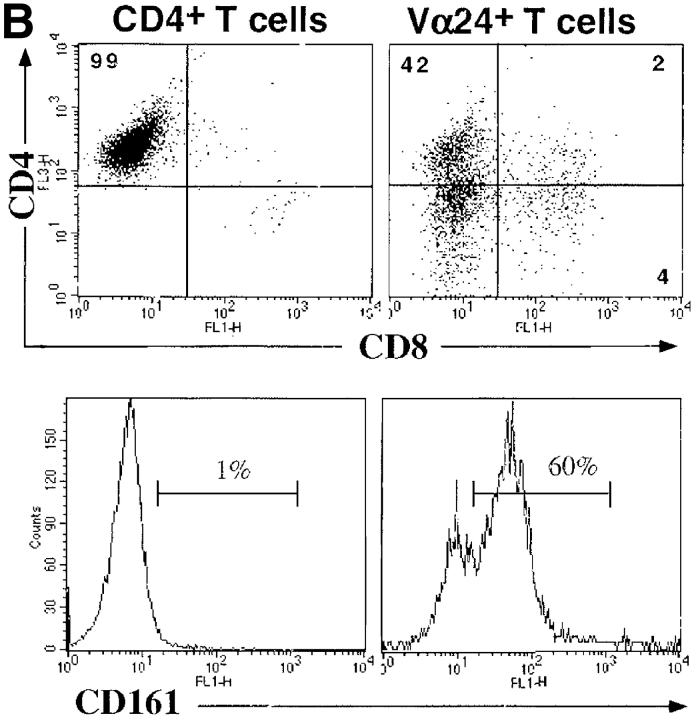
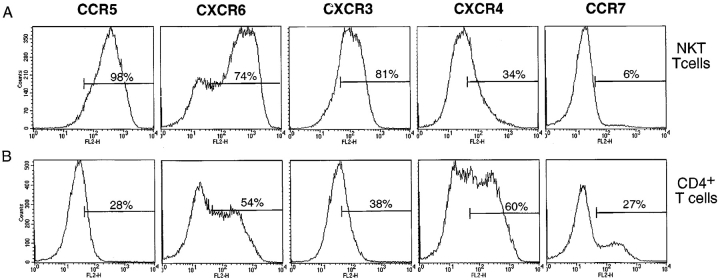
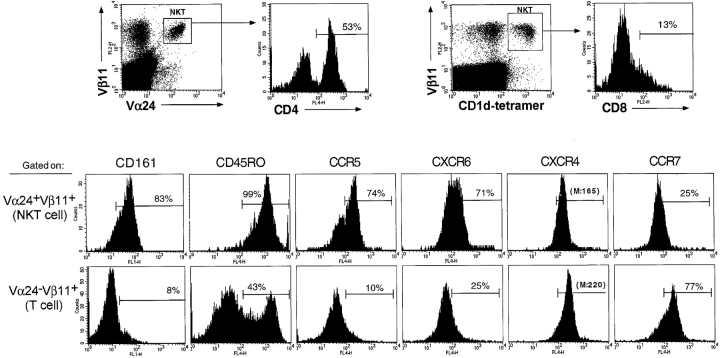
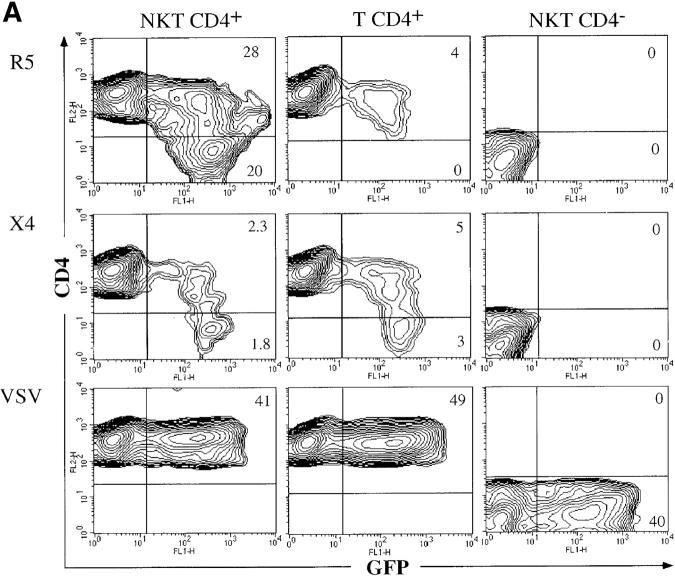
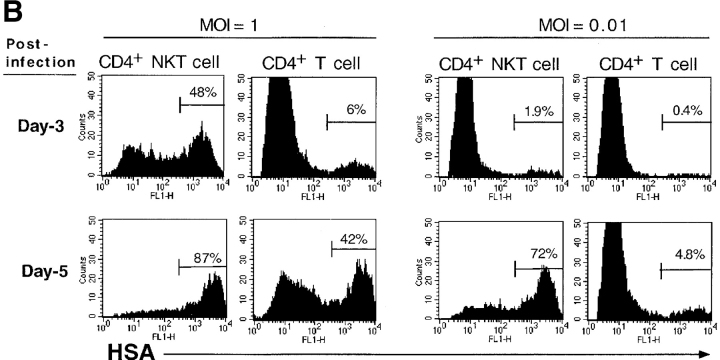
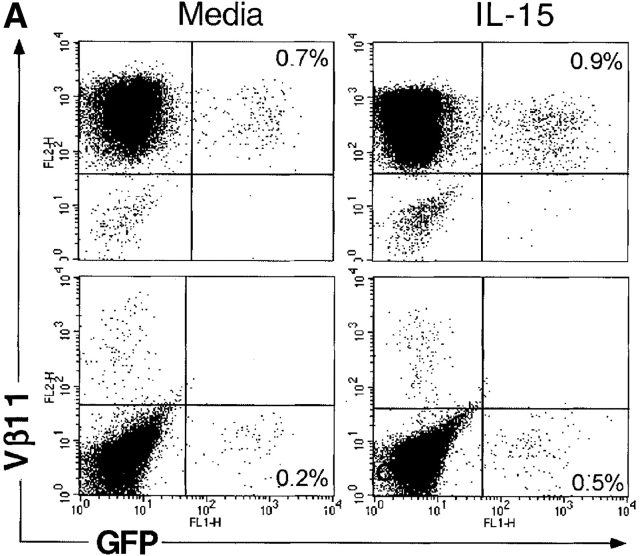
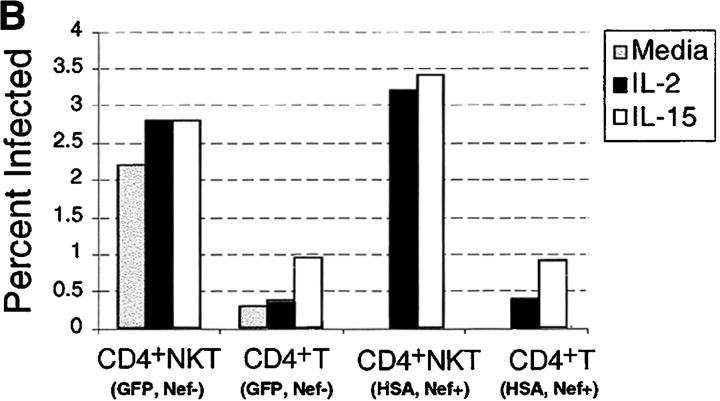
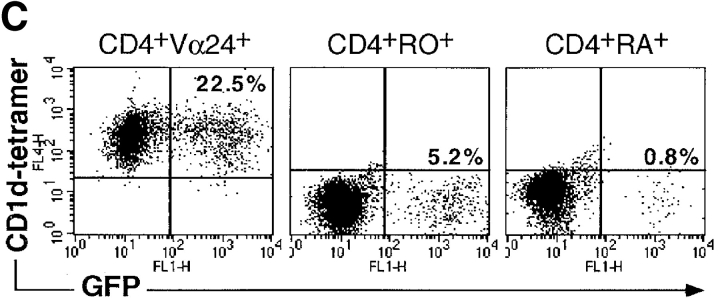
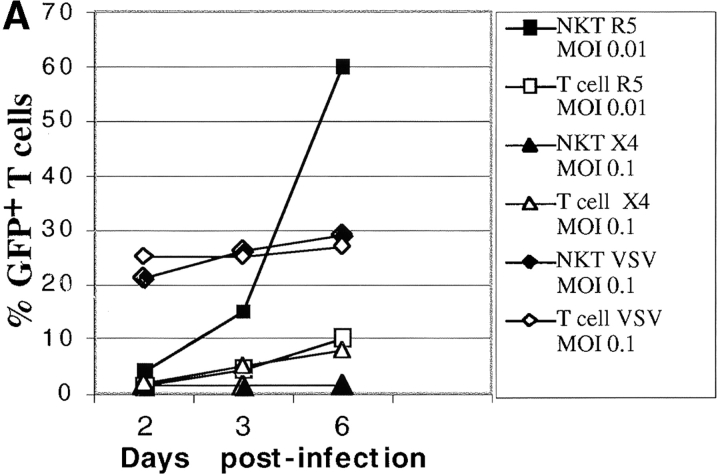
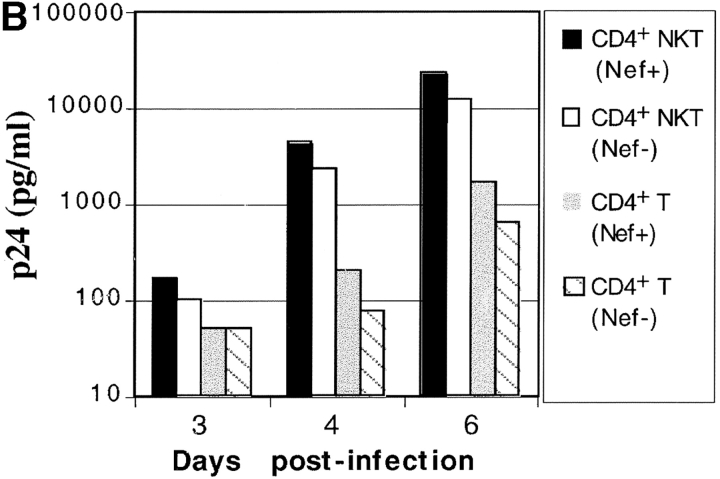
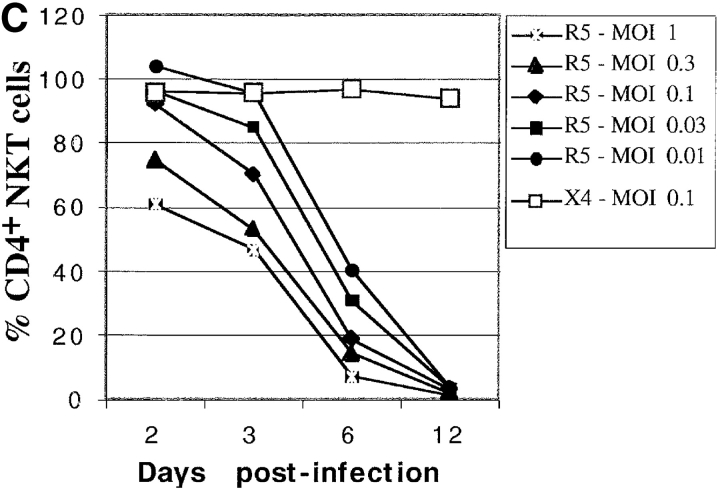
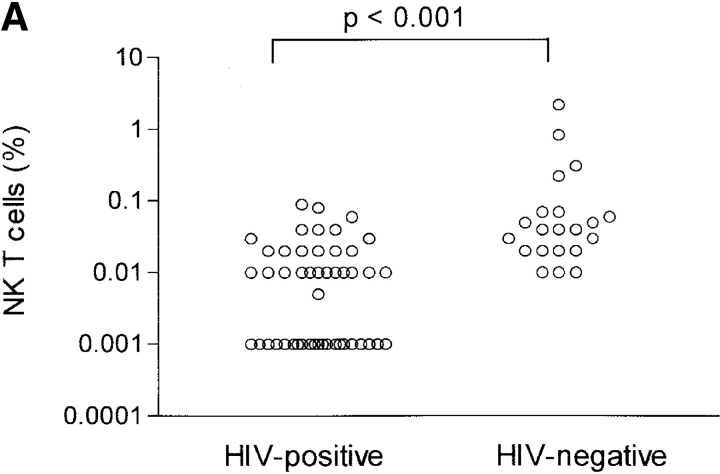
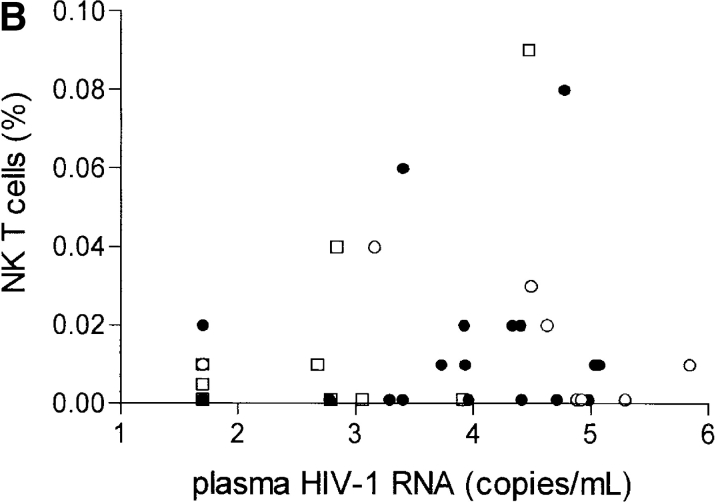
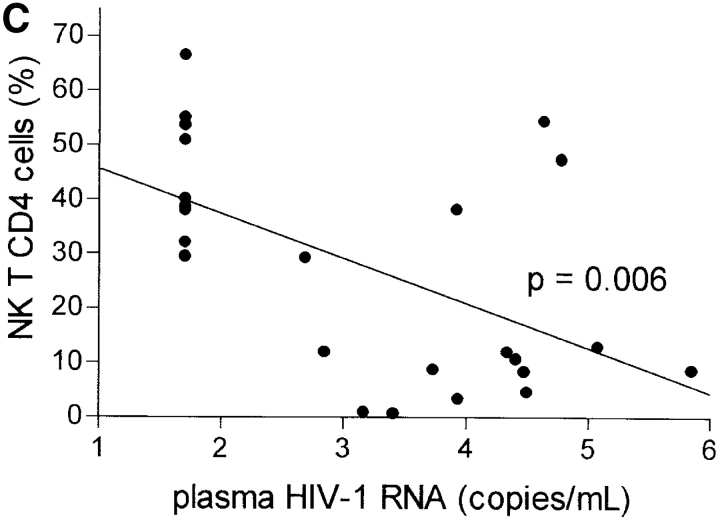
Human natural killer (NK) T cells are unique T lymphocytes that express an invariant T cell receptor (TCR) Valpha24-Vbeta11 and have been implicated to play a role in various diseases. A subset of NKT cells express CD4 and hence are potential targets for human immunodeficiency virus (HIV)-1 infection. We demonstrate that both resting and activated human Valpha24(+) T cells express high levels of the HIV-1 coreceptors CCR5 and Bonzo (CXCR6), but low levels of CCR7, as compared with conventional T cells. Remarkably NKT cells activated with alpha-galactosylceramide (alpha-GalCer)-pulsed dendritic cells were profoundly more susceptible to infection with R5-tropic, but not X4-tropic, strains of HIV-1, compared with conventional CD4(+) T cells. Furthermore, resting CD4(+) NKT cells were also more susceptible to infection. After initial infection, HIV-1 rapidly replicated and depleted the CD4(+) subset of NKT cells. In addition, peripheral blood NKT cells were markedly and selectively depleted in HIV-1 infected individuals. Although the mechanisms of this decline are not clear, low numbers or absence of NKT cells may affect the course of HIV-1 infection. Taken together, our findings indicate that CD4(+) NKT cells are directly targeted by HIV-1 and may have a potential role during viral transmission and spread in vivo.


Figures

Figure 1.
Figure 1.
Phenotype of in vitro–expanded NKT cells. Purified CD4+ T cells were activated by SEB (100 ng/ml) and purified Vα24+ T cells were stimulated with α-GalCer (100 ng/ml) in the presence of autologous DCs. Cells were expanded in IL-2 for 14 d. (A) To determine expansion of NKT cells in vitro–expanded T cell lines were stained with anti-Vβ11-PE, anti-Vα24-FITC, and CD1d-tetramer-APC. (B) Expression of CD4, CD8, and NK markers on SEB-stimulated CD4+ or α-GalCer-stimulated NKT cell lines. Cells were costained with anti-CD4-PercP and anti-CD8-FITC, and individually stained with purified anti-CD161 followed by FITC-conjugated anti–mouse IgG.
Figure 1.
Figure 1.
Phenotype of in vitro–expanded NKT cells. Purified CD4+ T cells were activated by SEB (100 ng/ml) and purified Vα24+ T cells were stimulated with α-GalCer (100 ng/ml) in the presence of autologous DCs. Cells were expanded in IL-2 for 14 d. (A) To determine expansion of NKT cells in vitro–expanded T cell lines were stained with anti-Vβ11-PE, anti-Vα24-FITC, and CD1d-tetramer-APC. (B) Expression of CD4, CD8, and NK markers on SEB-stimulated CD4+ or α-GalCer-stimulated NKT cell lines. Cells were costained with anti-CD4-PercP and anti-CD8-FITC, and individually stained with purified anti-CD161 followed by FITC-conjugated anti–mouse IgG.
Figure 2.
Figure 2.
Expression of chemo-kine receptors on in vitro–activated NKT cells. T cell lines were expanded as described in the legend of Fig. 1 and stained with chemokine receptor antibodies followed by PE-conjugated anti–mouse IgG. (A) α-GalCer–stimulated NKT cells. (B) SEB-stimulated CD4+ T cells.
Figure 3.
Figure 3.
Phenotype of resting NKT cells in PBMCs. PBMCs from healthy donors were first stained with anti-Vβ11-PE, anti-CD3-PercP.Cy5.5, and either anti-Vα24-FITC or CD1d-tetramer-APC in combination with anti-CD4-APC, and anti-CD8-PE. To stain with mAbs directed against CD161, CD45RO, and chemokine receptors, CCR5, CXCR6, CCR7, CXCR4, cells were first incubated with purified antibodies, followed by second step staining with anti–mouse IgG-APC. After extensive washing cells were preincubated with mouse Ig to neutralize any free anti–mouse Ig. Cells were then stained with anti-Vβ11-PE, Vα24-FITC, and CD3-PercP-Cy5.5. Electronic gates were set on CD3+ Vα24+Vβ11+ or CD3+Vβ11+CD1d-tetramer+ T cells or Vα24Vβ11+ cells to analyze expression of molecules, listed above, on NKT and conventional T cells, respectively. For CXCR4 expression, mean intensity of fluorescence is shown.
Figure 4.
Figure 4.
Infection of NKT cells by HIV-1. SEB-stimulated CD4+ T cells and α-GalCer stimulated NKT cell cultures were described in Fig. 1 legend. Activated NKT cells were further sorted into CD4+ and CD4 subsets. At days 7–10 after activation cells were infected with: (A) GFP-encoding R5-tropic, X4-tropic viruses, or VSV-G pseudotyped HIV vector at MOI of 1. After 3 d, cells were stained with anti-CD4-PE, fixed with 2% paraformaldehyde, and GFP expression was analyzed by FACS®. (B) Cells were also infected with HSA-encoding nef + R5-tropic viruses at MOI 1 and 0.01. After 3 and 5 d after infection, cells were stained with FITC-conjugated anti–mouse HSA, fixed with 2% paraformaldehyde, and HSA expression was analyzed by FACS®.
Figure 4.
Figure 4.
Infection of NKT cells by HIV-1. SEB-stimulated CD4+ T cells and α-GalCer stimulated NKT cell cultures were described in Fig. 1 legend. Activated NKT cells were further sorted into CD4+ and CD4 subsets. At days 7–10 after activation cells were infected with: (A) GFP-encoding R5-tropic, X4-tropic viruses, or VSV-G pseudotyped HIV vector at MOI of 1. After 3 d, cells were stained with anti-CD4-PE, fixed with 2% paraformaldehyde, and GFP expression was analyzed by FACS®. (B) Cells were also infected with HSA-encoding nef + R5-tropic viruses at MOI 1 and 0.01. After 3 and 5 d after infection, cells were stained with FITC-conjugated anti–mouse HSA, fixed with 2% paraformaldehyde, and HSA expression was analyzed by FACS®.
Figure 5.
Figure 5.
HIV-1 infection of resting or cytokine stimulated NKT cells in PBMCs. PBMCs were isolated and incubated for one day either in media alone or in the presence of IL-2 (50 U/ml) or IL-15 (10 ng/ml). Cells were then infected with R5-tropic virus expressing GFP or HSA. After 3 d of infection PBMCs were stained with CD3-PercP.Cy5.5, Vβ11-PE, and Vα24-biotin followed by strepavidin-APC. Cells that were infected with HSA-expressing viruses were also stained with HSA-FITC. (A) Approximately 10 million events were acquired for each sample to obtain statistically significant number of infected NKT cells. NKT cells were identified by gating on CD3+Vα24+ cells and staining for Vβ11 (top), conventional T cells were gated on CD3+Vα24 cells (bottom). To facilitate visual comparison, only 1% of events acquired is shown for conventional T cells (bottom). (B) Cells were also stained with CD4-Percp, Vβ11-PE, and Vα24-biotin followed by strepavidin-APC to determine the percent of CD4+ NKT and conventional T cells that are infected with HIV-1. (C) Purified CD4+Vα24+ (NKT), CD4+CD45RO+ (memory T), CD4+CD45RA+ (naive T), were stimulated through TCR and infected with R5-tropic HIV-1 expressing GFP. At 3 d after infection cells were stained with CD1d-tetramer-APC, CD25-PE (RA+ or RO+ T cells), or with Vβ11-PE (Vα24+ T cells) and CD11b-Cy. Electronic gates were set on CD25+CD11b (for RO+ and RA+) or Vβ11+CD11b (for Vα24+) T cells and on large cell size.
Figure 5.
Figure 5.
HIV-1 infection of resting or cytokine stimulated NKT cells in PBMCs. PBMCs were isolated and incubated for one day either in media alone or in the presence of IL-2 (50 U/ml) or IL-15 (10 ng/ml). Cells were then infected with R5-tropic virus expressing GFP or HSA. After 3 d of infection PBMCs were stained with CD3-PercP.Cy5.5, Vβ11-PE, and Vα24-biotin followed by strepavidin-APC. Cells that were infected with HSA-expressing viruses were also stained with HSA-FITC. (A) Approximately 10 million events were acquired for each sample to obtain statistically significant number of infected NKT cells. NKT cells were identified by gating on CD3+Vα24+ cells and staining for Vβ11 (top), conventional T cells were gated on CD3+Vα24 cells (bottom). To facilitate visual comparison, only 1% of events acquired is shown for conventional T cells (bottom). (B) Cells were also stained with CD4-Percp, Vβ11-PE, and Vα24-biotin followed by strepavidin-APC to determine the percent of CD4+ NKT and conventional T cells that are infected with HIV-1. (C) Purified CD4+Vα24+ (NKT), CD4+CD45RO+ (memory T), CD4+CD45RA+ (naive T), were stimulated through TCR and infected with R5-tropic HIV-1 expressing GFP. At 3 d after infection cells were stained with CD1d-tetramer-APC, CD25-PE (RA+ or RO+ T cells), or with Vβ11-PE (Vα24+ T cells) and CD11b-Cy. Electronic gates were set on CD25+CD11b (for RO+ and RA+) or Vβ11+CD11b (for Vα24+) T cells and on large cell size.
Figure 6.
Figure 6.
HIV-1 replication in NKT cell lines. (A) CD4+ and NKT cell lines were infected with R5-tropic, X4-tropic or VSV-G pseudo-typed HIV-1 at varying MOI (0.01–1). After 2, 3, and 6 d of infection cells were stained with anti-CD4-PE, fixed and analyzed by FACS®. The percentage of GFP+ cells in the cultures is shown. (B) Supernatants from NKT cell cultures, infected with wild-type nef +, or nef virus MOI of 0.002 (p24: ∼200pg/ml), were collected at different time points and HIV p24 levels were measured by ELISA. (C) Numbers of CD4+ NKT cells were monitored in unsorted NKT cell lines at 2, 3, 6, and 12 d after infection by staining with anti-CD4-PE.
Figure 6.
Figure 6.
HIV-1 replication in NKT cell lines. (A) CD4+ and NKT cell lines were infected with R5-tropic, X4-tropic or VSV-G pseudo-typed HIV-1 at varying MOI (0.01–1). After 2, 3, and 6 d of infection cells were stained with anti-CD4-PE, fixed and analyzed by FACS®. The percentage of GFP+ cells in the cultures is shown. (B) Supernatants from NKT cell cultures, infected with wild-type nef +, or nef virus MOI of 0.002 (p24: ∼200pg/ml), were collected at different time points and HIV p24 levels were measured by ELISA. (C) Numbers of CD4+ NKT cells were monitored in unsorted NKT cell lines at 2, 3, 6, and 12 d after infection by staining with anti-CD4-PE.
Figure 7.
Figure 7.
Analysis of NKT cells in HIV-1 infected and healthy donors. PBMCs from healthy and HIV-infected donors were isolated and stained with anti-Vβ11-FITC, CD3-PercP.Cy5.5, CD4-PE, and CD1d-tetramer-APC. Alternatively, cells were stained with anti-Vβ11-PE, Vα24-FITC, CD3-PercP.Cy5.5, and CD4-APC. Electronic gates were set on CD3+Vβ11+Vα24+ or CD3+Vβ11+CD1d-tetramer+ cells to identify the NKT cell subset. Between 3 and 5 million events were collected for each sample. Analysis was performed on CD3-gated T cells. The sensitivity for detecting NKT cells was at least 0.003%. (A) Portion of NKT cells among CD3+ T cells of 48 HIV-infected (left) and 22 HIV-negative subjects (right). (B) Relationships between NKT cell percentage, plasma HIV-1 RNA concentration, and CD4+ T cell counts in HIV-1–infected individuals. CD4+ T cells were <200 cells/mm3 (white circles), 200–500 cells/mm3 (black circles), or >500 cells/mm3 (white squares). (C) Relationship between CD4+ NKT cell percentage and plasma HIV-1 RNA concentration in HIV-1–infected subjects. The regression line is shown.
Figure 7.
Figure 7.
Analysis of NKT cells in HIV-1 infected and healthy donors. PBMCs from healthy and HIV-infected donors were isolated and stained with anti-Vβ11-FITC, CD3-PercP.Cy5.5, CD4-PE, and CD1d-tetramer-APC. Alternatively, cells were stained with anti-Vβ11-PE, Vα24-FITC, CD3-PercP.Cy5.5, and CD4-APC. Electronic gates were set on CD3+Vβ11+Vα24+ or CD3+Vβ11+CD1d-tetramer+ cells to identify the NKT cell subset. Between 3 and 5 million events were collected for each sample. Analysis was performed on CD3-gated T cells. The sensitivity for detecting NKT cells was at least 0.003%. (A) Portion of NKT cells among CD3+ T cells of 48 HIV-infected (left) and 22 HIV-negative subjects (right). (B) Relationships between NKT cell percentage, plasma HIV-1 RNA concentration, and CD4+ T cell counts in HIV-1–infected individuals. CD4+ T cells were <200 cells/mm3 (white circles), 200–500 cells/mm3 (black circles), or >500 cells/mm3 (white squares). (C) Relationship between CD4+ NKT cell percentage and plasma HIV-1 RNA concentration in HIV-1–infected subjects. The regression line is shown.

References

    1. Bendelac, A., M.N. Rivera, S.H. Park, and J.H. Roark. 1997. Mouse CD1-specific NK1 T cells: development, specificity, and function. Annu. Rev. Immunol. 15:535–562. - PubMed
    1. Taniguchi, M., and T. Nakayama. 2000. Recognition and function of Vα14 NKT cells. Semin. Immunol. 12:543–550. - PubMed
    1. Joyce, S. 2001. CD1d and natural T cells: how their properties jump-start the immune system. Cell. Mol. Life Sci. 58:442–469. - PMC - PubMed
    1. Porcelli, S., C.E. Yockey, M.B. Brenner, and S.P. Balk. 1993. Analysis of T cell antigen receptor (TCR) expression by human peripheral blood CD4−8− α/β T cells demonstrates preferential use of several Vβ genes and an invariant TCR α chain. J. Exp. Med. 178:1–16. - PMC - PubMed
    1. Dellabona, P., E. Padovan, G. Casorati, M. Brockhaus, and A. Lanzavecchia. 1994. An invariant Vα 24-Jα Q/Vβ 11 T cell receptor is expressed in all individuals by clonally expanded CD4−8− T cells. J. Exp. Med. 180:1171–1176. - PMC - PubMed

Publication types

MeSH terms