. 2002 Apr 1;195(7):907-18.
doi: 10.1084/jem.20011797.

Role of p75 neurotrophin receptor in the neurotoxicity by beta-amyloid peptides and synergistic effect of inflammatory cytokines

Affiliations

Role of p75 neurotrophin receptor in the neurotoxicity by beta-amyloid peptides and synergistic effect of inflammatory cytokines

Giovanni Perini et al. J Exp Med. .

Erratum in

  • J Exp Med 2002 May 6;195(9):1231

Abstract

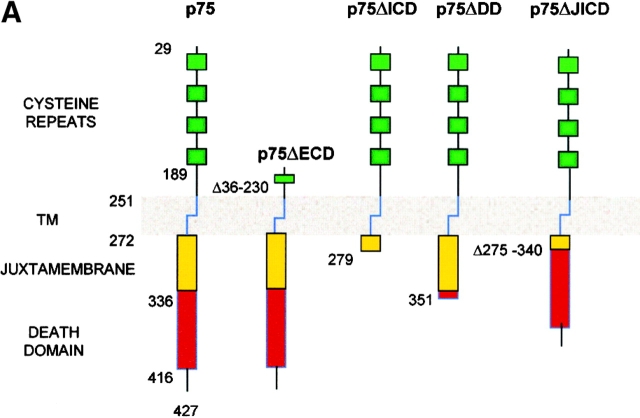
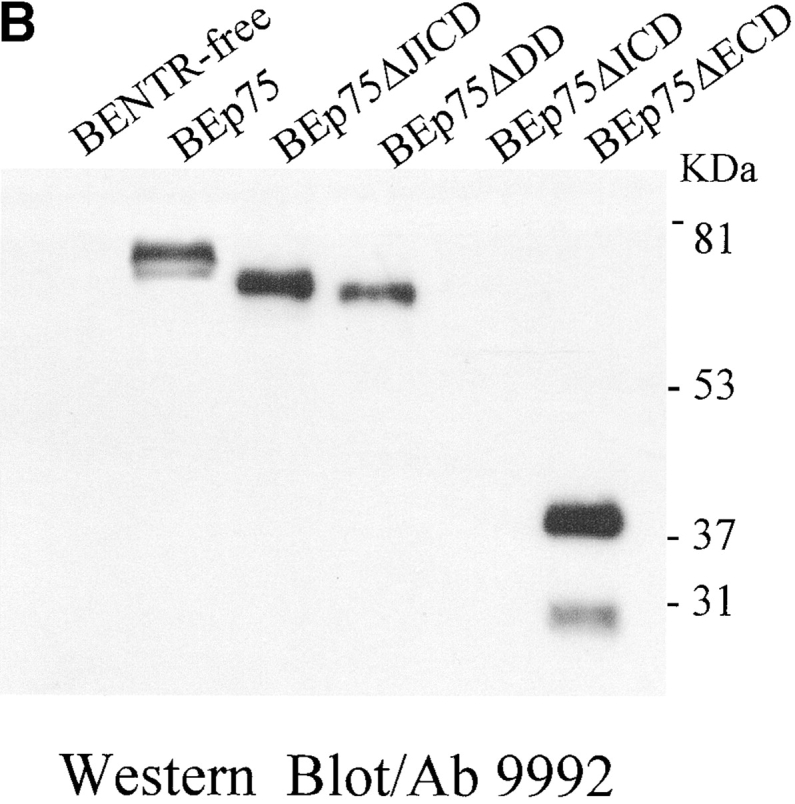
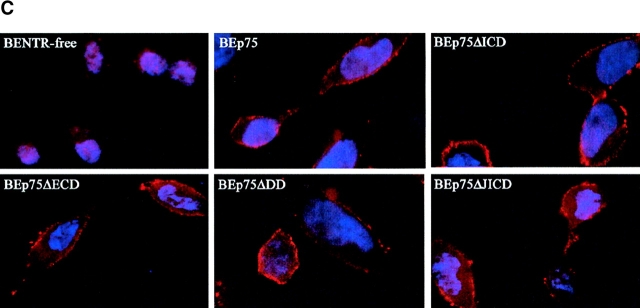
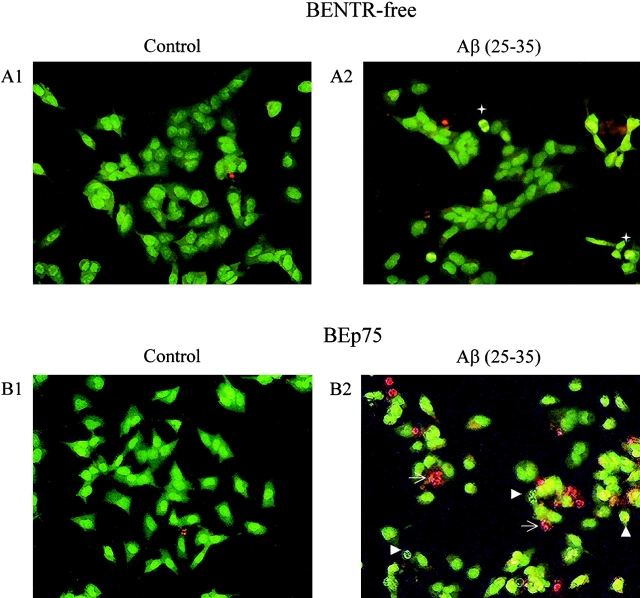
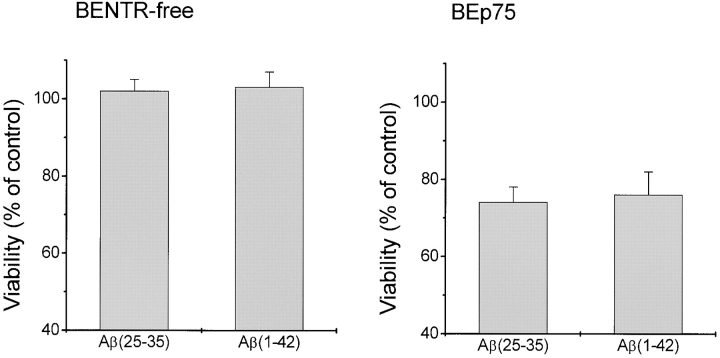
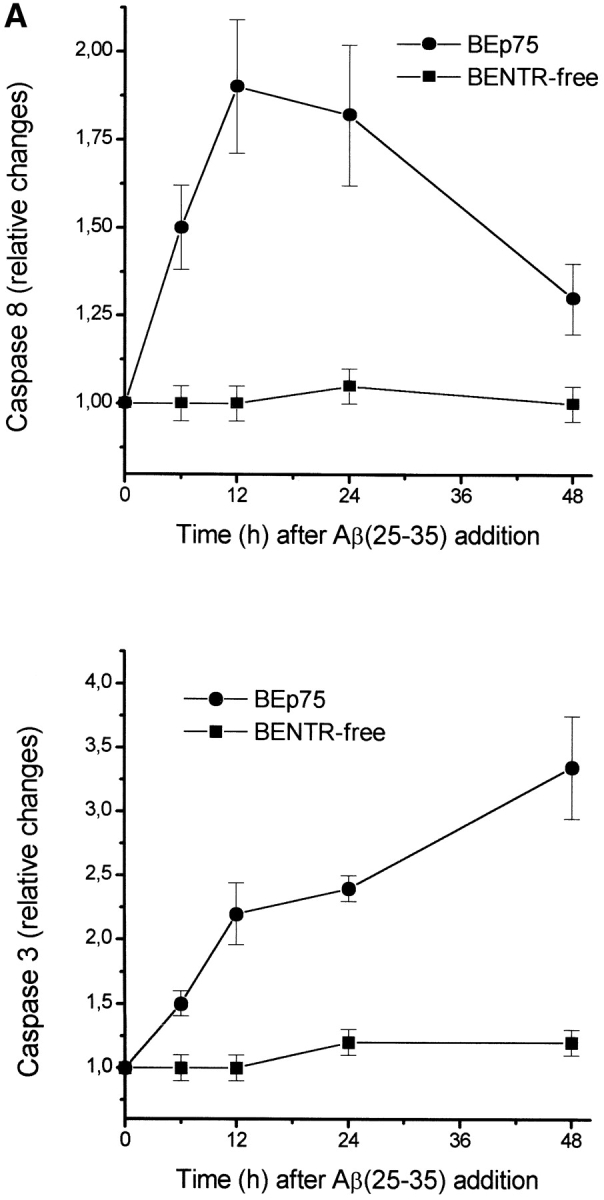
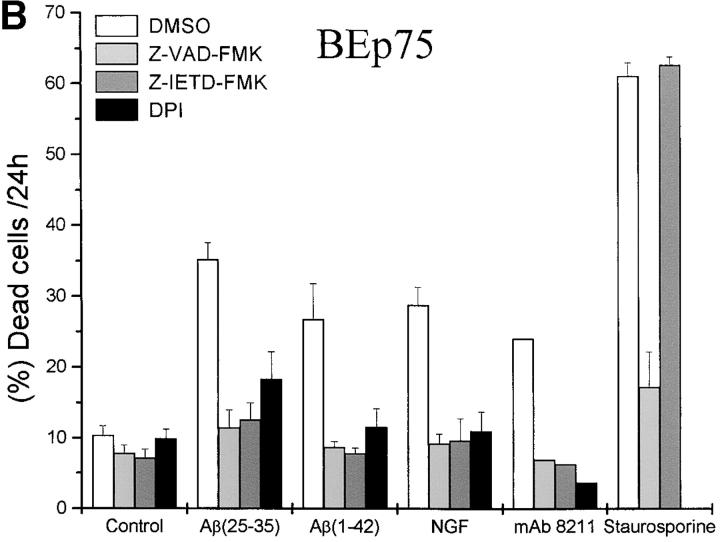
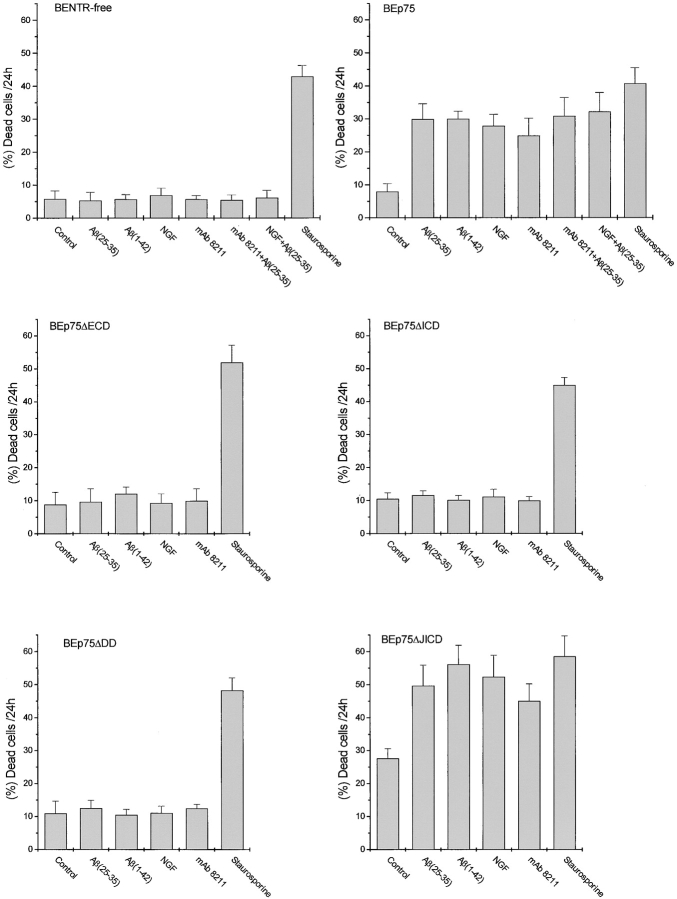
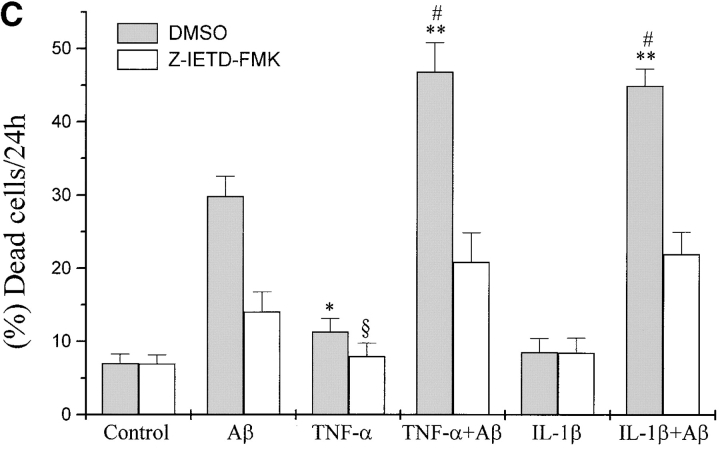
The neurodegenerative changes in Alzheimer's disease (AD) are elicited by the accumulation of beta-amyloid peptides (Abeta), which damage neurons either directly by interacting with components of the cell surface to trigger cell death signaling or indirectly by activating astrocytes and microglia to produce inflammatory mediators. It has been recently proposed that the p75 neurotrophin receptor (p75(NTR)) is responsible for neuronal damage by interacting with Abeta. By using neuroblastoma cell clones lacking the expression of all neurotrophin receptors or engineered to express full-length or various truncated forms of p75(NTR), we could show that p75(NTR) is involved in the direct signaling of cell death by Abeta via the function of its death domain. This signaling leads to the activation of caspases-8 and -3, the production of reactive oxygen intermediates and the induction of an oxidative stress. We also found that the direct and indirect (inflammatory) mechanisms of neuronal damage by Abeta could act synergistically. In fact, TNF-alpha and IL-1beta, cytokines produced by Abeta-activated microglia, could potentiate the neurotoxic action of Abeta mediated by p75(NTR) signaling. Together, our results indicate that neurons expressing p75(NTR), mostly if expressing also proinflammatory cytokine receptors, might be preferential targets of the cytotoxic action of Abeta in AD.


Figures

Figure 1.
Figure 1.
Expression of p75NTR in SK-N-BE neuroblastoma clones. (A) Schematic depiction of the full-length and truncated p75NTR proteins expressed in transfected SK-N-BE clones. Specifically, p75NTR, full-length receptor; p75ΔECD, p75 lacking the extracellular region (aa 36–230); p75ΔICD, p75 lacking the whole cytoplasmatic region (aa 280–427); p75ΔDD, p75 lacking the intracellular DD (aa 352–427); p75ΔJICD, p75 lacking the cytoplasmic JICD (aa 275–340). TM, transmembrane region. (B) p75NTR protein levels (Western blot analysis) in BENTR-free cell clones transfected with different constructs of p75NTR. (C) Localization of the p75NTR protein at the plasmamembrane by immunostaining with 9992 antiserum in BENTR-free, BEp75, BEp75ΔECD, BEp75ΔDD, and BEp75ΔJICD cell clones, and with mAb ME20.4 in BEp75ΔICD cell clones; the detection was performed by Cy3-conjugated anti–rabbit IgG or anti–mouse IgG; nuclei are blue-stained with DAPI.
Figure 1.
Figure 1.
Expression of p75NTR in SK-N-BE neuroblastoma clones. (A) Schematic depiction of the full-length and truncated p75NTR proteins expressed in transfected SK-N-BE clones. Specifically, p75NTR, full-length receptor; p75ΔECD, p75 lacking the extracellular region (aa 36–230); p75ΔICD, p75 lacking the whole cytoplasmatic region (aa 280–427); p75ΔDD, p75 lacking the intracellular DD (aa 352–427); p75ΔJICD, p75 lacking the cytoplasmic JICD (aa 275–340). TM, transmembrane region. (B) p75NTR protein levels (Western blot analysis) in BENTR-free cell clones transfected with different constructs of p75NTR. (C) Localization of the p75NTR protein at the plasmamembrane by immunostaining with 9992 antiserum in BENTR-free, BEp75, BEp75ΔECD, BEp75ΔDD, and BEp75ΔJICD cell clones, and with mAb ME20.4 in BEp75ΔICD cell clones; the detection was performed by Cy3-conjugated anti–rabbit IgG or anti–mouse IgG; nuclei are blue-stained with DAPI.
Figure 2.
Figure 2.
Epifluorescence microscopic analysis of cell damage by Aβ. (A1) and (A2) BENTR-free cells, untreated and treated for 24 h with Aβ(25–35) (20 μM), respectively. (B1) and (B2) BEp75 cells, untreated and treated for 24 h with Aβ(25–35) (20 μM), respectively. A pale green nuclear fluorescence by AO identifies still normal cells. A dazzling yellow nuclear fluorescence by AO (arrowheads) reveals the progressive chromatin condensation, collapse, and marginalization proper of apoptosis. A vivid red fluorescence of chromatin remnants by EB (arrows) denotes cells, whose membrane integrity was lost as the death process shifted from apoptosis to necrosis. +, mitosis.
Figure 3.
Figure 3.
Cell death analysis by MTS assay. BENTR-free and BEp75 cells were treated with Aβ(25–35) (20 μM), or Aβ(1–42) (5.0 μM) for 48 h, then evaluated for cell viability as compared with untreated controls. Data are means ±SD of four experiments.
Figure 4.
Figure 4.
Metabolic features of cell death induced by Aβ. (A) Time course of the activation of caspases-8 and -3 as induced by a treatment with Aβ(25–35) (20 μM). Results shown are means ±SD of four experiments. (B) Effect of Z-VAD-FMK (100 μM), a nonspecific inhibitor of caspases, of Z-IETD-FMK (20 μM), a specific inhibitor of caspase-8, and of DPI (100 nM), an inhibitor of ROI-forming NADPH oxidase and other flavoprotein dehydrogenases, on the cytotoxic activity by Aβ(25–35) (20 μM), Aβ(1–42) (5.0 μM), NGF (10 nM), mAb 8211 (5.0 μg/ml), and staurosporine (200 nM) in BEp75 cells. Data are reported as means ±SD of three to four experiments (mAb 8211, two experiments).
Figure 4.
Figure 4.
Metabolic features of cell death induced by Aβ. (A) Time course of the activation of caspases-8 and -3 as induced by a treatment with Aβ(25–35) (20 μM). Results shown are means ±SD of four experiments. (B) Effect of Z-VAD-FMK (100 μM), a nonspecific inhibitor of caspases, of Z-IETD-FMK (20 μM), a specific inhibitor of caspase-8, and of DPI (100 nM), an inhibitor of ROI-forming NADPH oxidase and other flavoprotein dehydrogenases, on the cytotoxic activity by Aβ(25–35) (20 μM), Aβ(1–42) (5.0 μM), NGF (10 nM), mAb 8211 (5.0 μg/ml), and staurosporine (200 nM) in BEp75 cells. Data are reported as means ±SD of three to four experiments (mAb 8211, two experiments).
Figure 5.
Figure 5.
Effect of Aβ and p75NTR agonists on cell death in neuroblastoma cell clones expressing different forms of p75NTR. BENTR-free cells lacking all the neurotrophin receptors and clones derived from them expressing the full length (BEp75) or differently truncated forms of p75NTR (compare with Fig. 1) were treated with Aβ(25–35) (20 μM), Aβ(1–42) (5.0 μM), NGF (10 nM), or mAb 8211 (5.0 μg/ml) and staurosporine (100 nM) for 24 h. The results of these experiments are reported as means ±SD of 5–10 experiments. In the case of BENTR-free cells and BEp75 cells the effects are also shown of a 2 h pretreatment with NGF (10 nM) or mAb 8211 (5.0 μg/ml) followed by Aβ(25–35) (20 μM). The results are reported as means ±SD of three or five experiments when the pretreatment was made with mAb 8211 or NGF, respectively.
Figure 6.
Figure 6.
Epifluorescence microscopic analysis of cell damage by NGF and mAb 8211. BEp75 cells untreated and treated for 24 h with NGF (10 nM) or mAb 8211 (5.0 μg/ml) (A) stained with OA plus EB (for details see Fig. 2), or (B) with Annexin V-FITC plus propidium iodide. (C) Phase contrast images corresponding to those in B.
Figure 6.
Figure 6.
Epifluorescence microscopic analysis of cell damage by NGF and mAb 8211. BEp75 cells untreated and treated for 24 h with NGF (10 nM) or mAb 8211 (5.0 μg/ml) (A) stained with OA plus EB (for details see Fig. 2), or (B) with Annexin V-FITC plus propidium iodide. (C) Phase contrast images corresponding to those in B.
Figure 7.
Figure 7.
Potentiation by TNF-α and IL-1β of the cytotoxic activity of Aβ. (A) Flow cytometric analysis of cell surface expression of TNF-α and IL-1β receptors: (a) fluorescence intensity of cells stained only with the secondary antibody; (b) with mAb utr-1 against TNFR75; (c) with mAb H398 against TNFR55; (d) with mAb 8211 against p75NTR as positive control; (e) with mAb against IL-1RI. (B) Synergistic effect of TNF-α on the cytotoxicity of Aβ(25–35) (20 μM). Data are means ±SD of three experiments. (C) Effect of IL-1β and TNF-α in the presence or absence of Z-IETD-FMK (20 μM). Data are means ±SD of 11 experiments in the absence and of three in the presence of Z-IETD-FMK with TNF-α with and without Aβ and of five experiments in the absence and three in the presence of Z-IETD-FMK with IL-1β with and without Aβ. TNF-α vs. control, *P < 0.05 (n = 11); **(Aβ[25–35] + TNF-α vs. Aβ[25 -35]), P < 0.001 (n = 11); (Aβ[25–35] + IL-1β vs. Aβ[25 -35]), P < 0.001 (n = 5); TNF-α + Z-IETD vs. TNF-α, § P < 0.05 (n = 3); #positive interaction (synergism) versus null interaction (additive effect) of the two factors, P < 0.001 (n = 11 for TNF-α and n = 5 for IL-1β).
Figure 7.
Figure 7.
Potentiation by TNF-α and IL-1β of the cytotoxic activity of Aβ. (A) Flow cytometric analysis of cell surface expression of TNF-α and IL-1β receptors: (a) fluorescence intensity of cells stained only with the secondary antibody; (b) with mAb utr-1 against TNFR75; (c) with mAb H398 against TNFR55; (d) with mAb 8211 against p75NTR as positive control; (e) with mAb against IL-1RI. (B) Synergistic effect of TNF-α on the cytotoxicity of Aβ(25–35) (20 μM). Data are means ±SD of three experiments. (C) Effect of IL-1β and TNF-α in the presence or absence of Z-IETD-FMK (20 μM). Data are means ±SD of 11 experiments in the absence and of three in the presence of Z-IETD-FMK with TNF-α with and without Aβ and of five experiments in the absence and three in the presence of Z-IETD-FMK with IL-1β with and without Aβ. TNF-α vs. control, *P < 0.05 (n = 11); **(Aβ[25–35] + TNF-α vs. Aβ[25 -35]), P < 0.001 (n = 11); (Aβ[25–35] + IL-1β vs. Aβ[25 -35]), P < 0.001 (n = 5); TNF-α + Z-IETD vs. TNF-α, § P < 0.05 (n = 3); #positive interaction (synergism) versus null interaction (additive effect) of the two factors, P < 0.001 (n = 11 for TNF-α and n = 5 for IL-1β).

References

    1. Hardy, J., and D. Allsop. 1991. Amyloid deposition as the central event in the aetiology of Alzheimer's disease. Trends Pharmacol. Sci. 12:383–388. - PubMed
    1. Yankner, B.A., and M.M. Mesulam. 1991. β–amyloid and the pathogenesis of Alzheimer's disease. N. Engl. J. Med. 325:1849–1857. - PubMed
    1. Selkoe, D.J. 1999. Translating cell biology into therapeutic advances in Alzheimer's disease. Nature. 399:A23–A31. - PubMed
    1. Iversen, L.L., R.J. Mortishire-Smith, S.J. Pollack, and M.S. Shearman. 1995. The toxicity in vitro of β–amyloid protein. Biochem. J. 311:1–16. - PMC - PubMed
    1. Pike, C.J., A.J. Walencewicz, C.G. Glabe, and C.W. Cotman. 1991. In vitro aging of β-amyloid protein causes peptide aggregation and neurotoxicity. Brain Res. 563:311–314. - PubMed

Publication types

MeSH terms