. 2002 Apr;119(4):373-88.
doi: 10.1085/jgp.20028479.

Calcium-induced transitions between the spontaneous miniature outward and the transient outward currents in retinal amacrine cells

Affiliations

Calcium-induced transitions between the spontaneous miniature outward and the transient outward currents in retinal amacrine cells

Pratip Mitra et al. J Gen Physiol. 2002 Apr.

Abstract

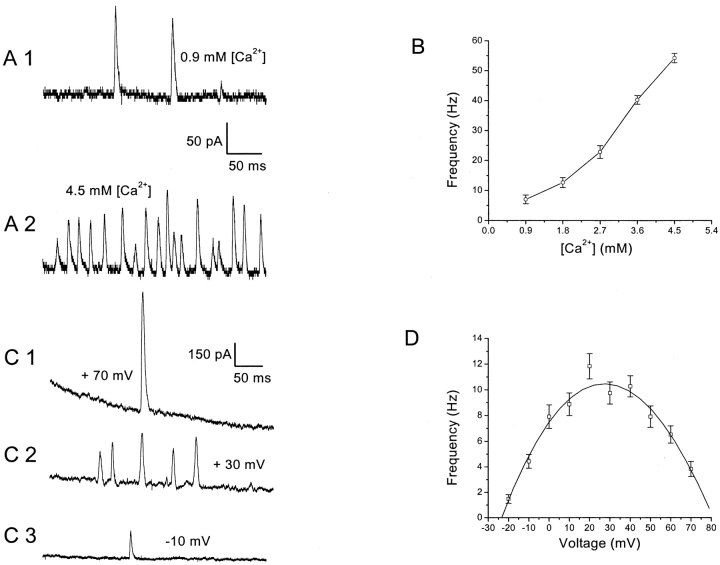
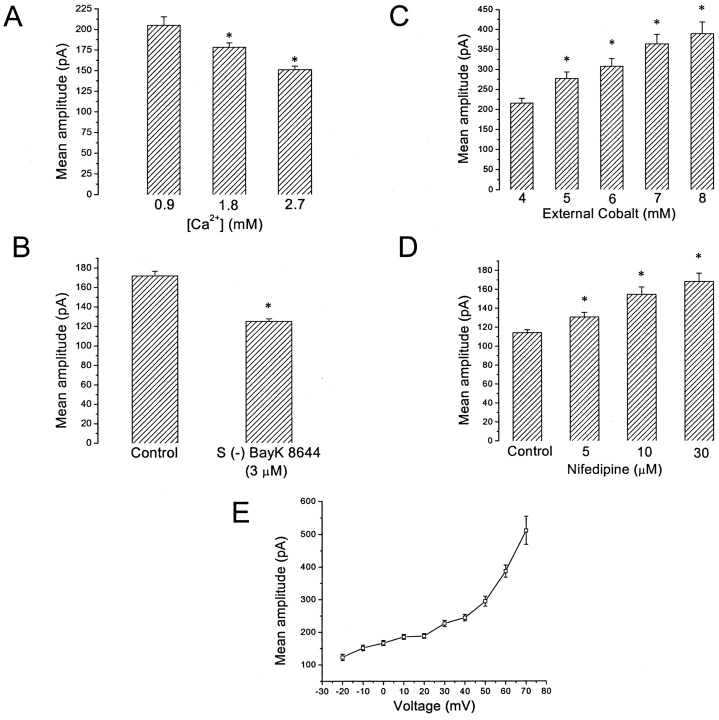
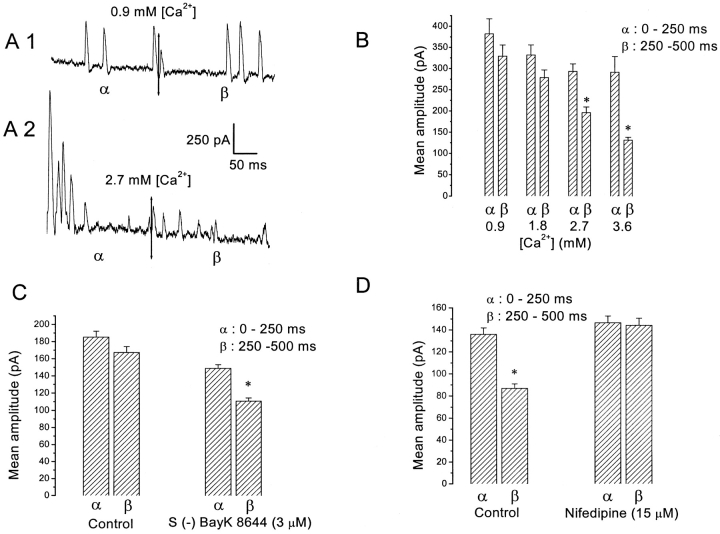
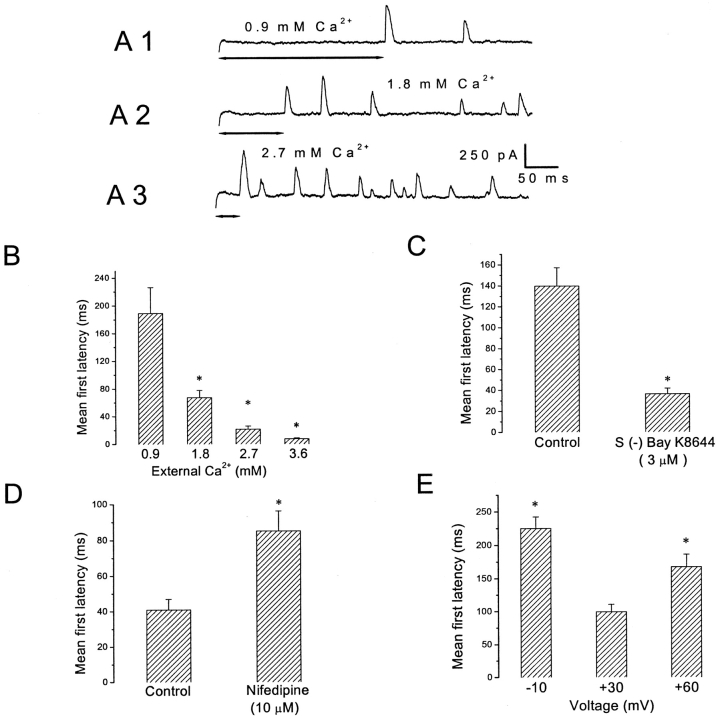
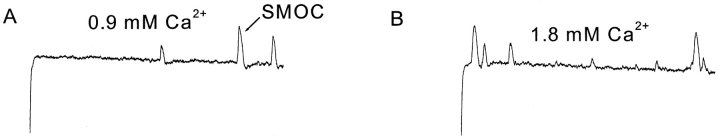
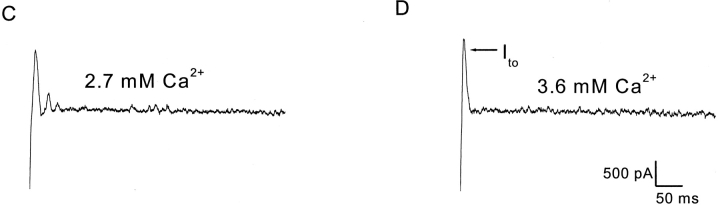
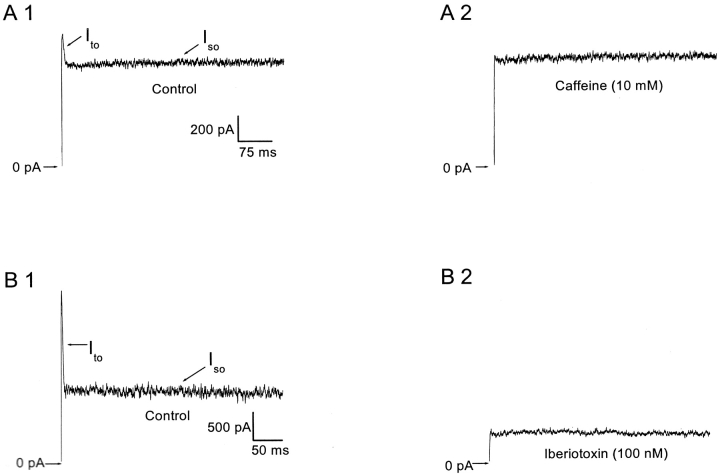
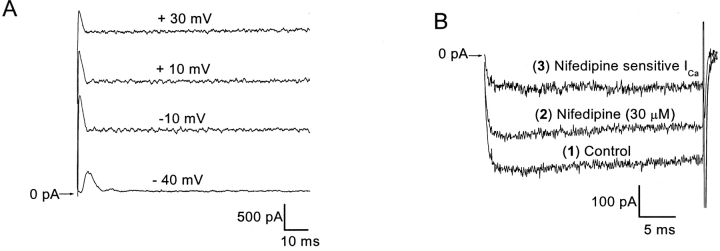
Spontaneous miniature outward currents (SMOCs) occur in a subset of retinal amacrine cells at membrane potentials between -60 and -40 mV. At more depolarized potentials, a transient outward current (I(to)) appears and SMOCs disappear. Both SMOCs and the I(to) are K(+) currents carried by BK channels. They both arise from Ca(2+) influx through high voltage-activated (HVA) Ca(2+) channels, which stimulates release of internal Ca(2+) from caffeine- and ryanodine-sensitive stores. An increase in Ca(2+) influx resulted in an increase in SMOC frequency, but also led to a decline in SMOC mean amplitude. This reduction showed a temporal dependence: the effect being greater in the latter part of a voltage step. Thus, Ca(2+) influx, although required to generate SMOCs, also produced a negative modulation of their amplitudes. Increasing Ca(2+) influx also led to a decline in the first latency to SMOC occurrence. A combination of these effects resulted in the disappearance of SMOCs, along with the concomitant appearance of the I(to) at high levels of Ca(2+) influx. Therefore, low levels of Ca(2+) influx, arising from low levels of activation of the HVA Ca(2+) channels, produce randomly occurring SMOCs within the range of -60 to -40 mV. Further depolarization leads to greater activation of the HVA Ca(2+) channels, larger Ca(2+) influx, and the disappearance of discontinuous SMOCs, along with the appearance of the I(to). Based on their characteristics, SMOCs in retinal neurons may function as synaptic noise suppressors at quiescent glutamatergic synapses.


Figures

F<sc>igure</sc> 1.
Figure 1.
SMOC frequency increases with increasing Ca2+ influx. (A) SMOCs generated at −10 mV in 6 mM Co2+ Ringer's containing either 0.9 mM Ca2+ (A1) or 4.5 mM Ca2+ (A2). SMOCs were superimposed on a baseline current of ∼65 pA. (B) Plot of SMOC frequency versus the extracellular Ca2+ concentration. Data generated from the same cell shown in A. (C) SMOCs generated in an amacrine cell at 70, 30, and −10 mV. SMOCs in C2 were superimposed on a baseline current of 670 pA, whereas those in C3 were on a current of 60 pA. The sag in trace C1 is presumably due to inactivation of the outward voltage–dependent current. In C1 the baseline current peaked at 1,493 pA and decayed to 841 pA at the end of the 500-ms pulse. (D) SMOCs were generated in 6 mM Co2+/1.8 mM Ca2+ Ringer's by voltage steps from −20 to 70 mV in 10-mV increments in the same cell shown in C. Data shows the relationship between SMOC frequency and voltage. The smooth line through the data points depicts the biphasic nature of the relationship.
F<sc>igure</sc> 2.
Figure 2.
Increasing Ca2+ influx leads to a graded reduction in peak SMOC amplitudes. (A) Average data from seven cells showing reduction of peak SMOC amplitudes with increasing amounts of extracellular [Ca2+]. SMOCs were generated in Ringer's containing 6 mM cobalt and varying amounts of Ca2+ (0.9–2.7 mM), with voltage steps to 30 mV. Asterisk indicates significance with reference to 0.9 mM [Ca2+]. (B) S (−) BayK 8644 (3 μM), a DHP agonist, caused a statistically significant reduction of peak SMOC amplitudes (P < 0.01, n = 6). SMOCs were generated in 6 mM Co2+/1.8 mM Ca2+ Ringer's with voltage steps to −10 mV. (C) SMOCs were generated by voltage steps to 30 mV with increasing amounts of Co2+ added to Ringer's containing 1.8 mM Ca2+. Asterisk indicates a statistically significant difference with reference to 4 mM external cobalt (P < 0.01). (D) Mean peak SMOC amplitudes from a representative cell with increasing doses of the DHP antagonist, nifedipine. Control SMOCs were generated in 6 mM Co2+/1.8 mM Ca2+ Ringer's with voltage steps to −10 mV. Asterisk indicates statistical significance at each dose with respect to control (P < 0.05). (E) I-V plot from a representative cell showing relationship between mean peak SMOC amplitudes and depolarization. SMOCs were generated in 6 mM Co2+/1.8 mM Ca2+ Ringer's by steps from −20 to 70 mV in 10-mV increments.
F<sc>igure</sc> 3.
Figure 3.
Temporal properties of SMOC amplitudes. (A) SMOCs generated by 500-ms steps to 30 mV in 6 mM Co2+ Ringer's containing either 0.9 mM Ca2+ or 2.7 mM Ca2+. The double-headed arrows in both traces separate the first 250 ms of the voltage step (α) and the second 250 ms (β). The notation α and β are used with the same meaning in the other panels. SMOCs in this cell were superimposed on a baseline current of ∼900 pA. (B) Data plot from the same cell showing mean peak SMOC amplitudes in the two intervals of the 500-ms voltage step. Asterisk indicates statistically significant difference in β as compared with α (P < 0.01). (C) Effect of DHP agonist, S (−) BayK 8644 (3 μM), on peak SMOC amplitudes in α and β intervals. SMOCs were generated in 6 mM Co2+/1.8 mM Ca2+ Ringer's with steps to −10 mV. Asterisk indicates statistically significant between α and β (P < 0.01). Data is an average of six cells. (D) The DHP antagonist, nifedipine (15 μM), eliminates the temporal dependence of SMOC amplitudes. Control SMOCs were generated at 30 mV in 6 mM Co2+/2.7 mM Ca2+ Ringer's, conditions which significantly lowered SMOC amplitude in the latter part (β) of the pulse (asterisk indicates P < 0.01). Nifedipine eliminates this temporal dependence (P > 0.05). Data is an average of five cells.
F<sc>igure</sc> 4.
Figure 4.
First latency to SMOC occurrence. (A) SMOCs generated at −10 mV in 6 mM Co2+ Ringer's containing either 0.9 mM (A 1), 1.8 mM (A 2), or 2.7 mM (A 3) [Ca2+]. The double-headed arrows indicate the first latency to occurrence. Baseline current was ∼130 pA. (B) Average first latency values from the same cell. Asterisks indicate values significantly lower than at 0.9 mM [Ca2+] (P < 0.01). (C) Mean first latency for SMOCs generated at −10 mV in 6 mM Co2+/1.8 mM Ca2+ Ringer, showing that 3 μM S (−) BayK 8644 decreased first latency (asterisk indicates P < 0.01). Data are the average of six cells. (D) Nifedipine (10 μM) significantly increased the first latency as compared with control (asterisk indicates P < 0.01). Data are average of seven cells. SMOCs were generated in 6 mM Co2+/1.8 mM Ca2+ Ringer's by steps to 30 mV. (E) Effect of cell voltage on first latency to SMOC occurrence. SMOCs were generated in 6 mM Co2+/1.8 mM Ca2+ Ringer's by voltage steps to −10, 30, and 60 mV. Asterisks indicate that the first latency values at −10 and 60 mV were significantly different from that obtained at 30 mV (P < 0.01). Data are an average of 10 cells.
F<sc>igure</sc> 5.
Figure 5.
Ca2+ influx induced transition between SMOCs and the Ito. Cells were bathed in 6 mM Co21/1.8 mM Ca2+ Ringer's and currents were elicited by depolarizing steps to 30 mV. SMOCs superimposed on a voltage-induced outward current of ∼1900 pA. Traces were from a representative cell in 0.9 (A), 1.8 (B), 2.7 (C), and 3.6 (D) mM [Ca2+]. Note the gradual disappearance of SMOCs and the concomitant appearance of a transient outward K+ current (Ito).
F<sc>igure</sc> 6.
Figure 6.
Pharmacological sensitivity of the Ito. (A1) Representative control trace generated in normal Ringer's at 10 mV shows the Ito. (A2) Addition of 10 mM caffeine selectively eliminated the Ito. (B1) Representative control trace generated at −30 mV shows the Ito. (B2) Addition of 100 nM iberiotoxin eliminated Ito in addition to reducing the sustained component, Iso. Recordings were made in normal Ringer's containing 0.1% wt/vol bovine serum albumin.
F<sc>igure</sc> 7.
Figure 7.
Lack of correspondence between temporal characteristics of Ito and the HVA Ca2+ current. (A) Representative recordings generated in normal Ringer's with voltage steps to −40, −10, 10, and 30 mV, showing that Ito decays completely within 10–15 ms after onset of the pulse. (B) Representative traces generated at 10 mV showing HVA Ca2+ currents. Ca2+ currents were isolated using 10 mM Ca2+/80 mM TEA solution extracellularly and an internal solution containing 70 mM TEA. Trace 1 represents control current, 2 depicts residual current remaining after addition of 30 μM nifedipine, and 3 represents the nifedipine-sensitive current obtained by subtraction of traces 1 and 2. None of these traces shows inactivation or transient features that correspond with Ito.

Similar articles

Cited by

References

    1. Avdonin, V., E.F. Shibata, and T. Hoshi. 1997. Dihydropyridine action on voltage-dependent potassium channels expressed in Xenopus oocytes. J. Gen. Physiol. 109:169–180. - PMC - PubMed
    1. Awatramani, G.B., and M.M. Slaughter. 2001. Intensity-dependent, rapid activation of presynaptic metabotropic glutamate receptors at a central synapse. J. Neurosci. 21:741–749. - PMC - PubMed
    1. Bean, B.P. 1989. Classes of calcium channels in vertebrate cells. Annu. Rev. Physiol. 51:367–384. - PubMed
    1. Benham, C.D., and T.B. Bolton. 1986. Spontaneous transient outward currents in single visceral and vascular smooth muscle cells of the rabbit. J. Physiol. 381:385–406. - PMC - PubMed
    1. Berridge, M.J. 1997. Elementary and global aspects of calcium signalling. J. Physiol. 499:291–306. - PMC - PubMed

Publication types

MeSH terms

Substances