. 2002 Apr 2;99(7):4424-9.
doi: 10.1073/pnas.072618599.

Evolutionary conservation of chromosome territory arrangements in cell nuclei from higher primates

Affiliations

Evolutionary conservation of chromosome territory arrangements in cell nuclei from higher primates

Hideyuki Tanabe et al. Proc Natl Acad Sci U S A. .

Abstract

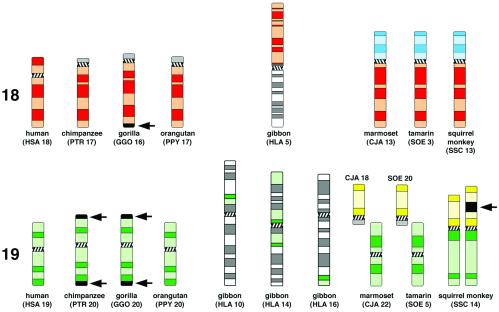
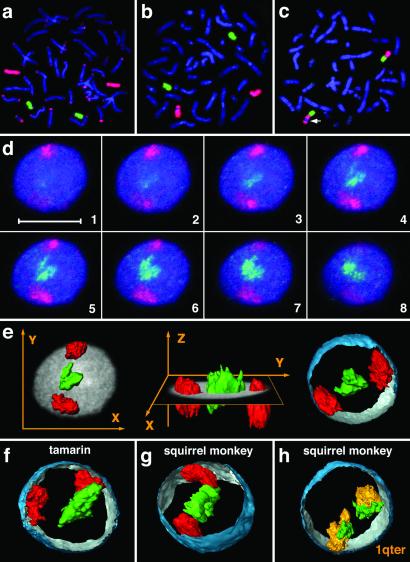
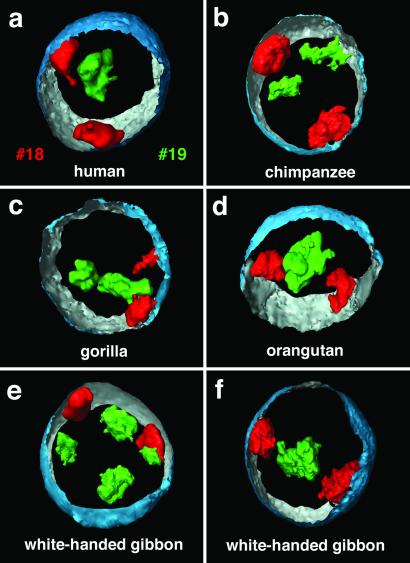
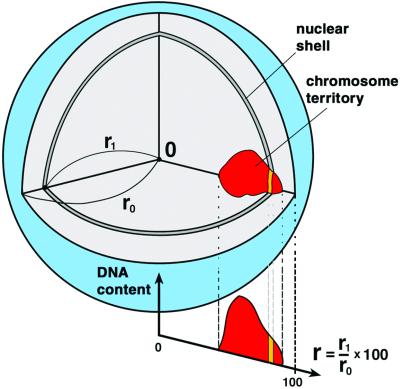
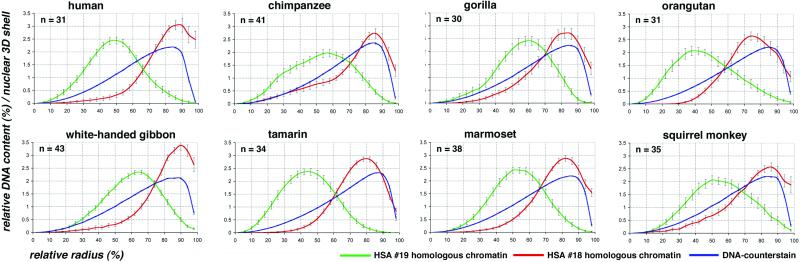
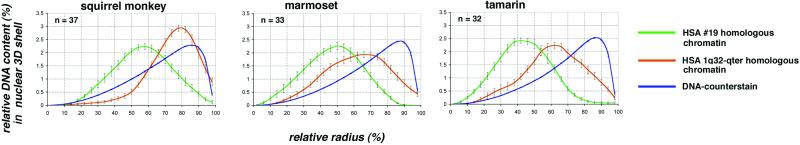
We demonstrate that the nuclear topological arrangement of chromosome territories (CTs) has been conserved during primate evolution over a period of about 30 million years. Recent evidence shows that the positioning of chromatin in human lymphocyte nuclei is correlated with gene density. For example, human chromosome 19 territories, which contain mainly gene-dense and early replicating chromatin, are located toward the nuclear center, whereas chromosome 18 territories, which consist mainly of gene-poor and later replicating chromatin, is located close to the nuclear border. In this study, we subjected seven different primate species to comparative analysis of the radial distribution pattern of human chromosome 18- and 19-homologous chromatin by three-dimensional fluorescence in situ hybridization. Our data demonstrate that gene-density-correlated radial chromatin arrangements were conserved during higher-primate genome evolution, irrespective of the major karyotypic rearrangements that occurred in different phylogenetic lineages. The evolutionarily conserved positioning of homologous chromosomes or chromosome segments in related species supports evidence for a functionally relevant higher-order chromatin arrangement that is correlated with gene-density.


Figures

Figure 1
Figure 1
Idiogramatic illustration of G-banded primate chromosomes or chromosomal subregions homolgous to human chromosome 18 (red; Upper) or 19 (green; Lower). Arrows indicate heterochromatin blocks not present in the human and orangutan chromosomes. P-arms of CJA13, SOE3, and SSC13 (highlighted light-blue) are homologous to HSA8p. SSC14p, CJA18, and SOE20 (highlighted yellow) are homologous to HSA1q32→qter. The investigated squirrel monkey individual showed an interstitial repeat heteromorphism in SSC14p (arrow). Chromosome nomenclature followed refs. , , , and .
Figure 2
Figure 2
Visualization of chromosomes and chromosome territories. (a and b) Hybridization of GGO16 (red) and PPY20 (green) to gorilla and human metaphase preparations. (a) In the gorilla, extensive cross hybridization of subtelomeric heterochromatin was observed when employing a gorilla paint (red), whereas the orangutan paint (green) yielded no cross hybridization. (b) In human, both probes produced highly specific hybridization signals. These experiments demonstrate the necessity to use probes derived from evolutionarily closely related, but different species than the target species for the unequivocal and exclusive delineation of homologous chromatin in subsequent 3D-FISH experiments (see Materials and Methods for details). (c) In the squirrel monkey, SOE5 (green) and LLA25 (red) visualize syntenic association of HSA19 (green) and HSA1q32→qter (red) homologous material. The polymorphic heterochromatin block is marked by an arrow (see also Fig. 1 and Discussion for details). (d) Gallery of 200-nm serial light optical sections (every third section shown) through a marmoset lymphoblastoid cell nucleus after painting of HSA18 (red) and HSA19 (green) homologous chromosome material, DNA counterstain shown in blue. (Scale bar = 10 μm.) (e) Three-dimensional reconstructions of painted CTs presented in d. In the X, Y view (Left) and X, Z view (Center), the mid-plane section of the counterstained nucleus is added as a gray shade. (Right) CTs together with a partial 3D reconstruction of the DNA-counterstained nuclear border (outside, blue; inside, silver-gray). (f and g) Three-dimensional reconstructions of chromosome material homologous to HSA18 and HSA19 in a tamarin and squirrel monkey nuclei. (h) Three-dimensional reconstruction of the two SSC14 territories in a squirrel monkey nucleus after two-color FISH of SSC14q (green; homologous to HSA19) and SSC14p (orange; homologous to HSA1q32→qter; compare Fig. 1). The origin of paint probes used for each species is described in Table 1.
Figure 3
Figure 3
Three-dimensionally reconstructed CTs in great apes and white-handed gibbon nuclei. (a) Three-dimensional positioning of HSA18 (red) and HSA19 (green) CTs in a human lymphoblastoid cell nucleus with the partially reconstructed nuclear border (outside, blue; inside, silver-gray). (bd) Three-dimensional positioning of HSA18 and HSA19-homologous CTs in nuclei of great apes. In correspondence with the situation in human lymphoblastoid cell nuclei, the HSA18-homologous CTs were always positioned close to the nuclear border. The relative locations of the CTs, however, varied from a close neighborhood to opposite positions (for example, compare b and c). (e and f) Two gibbon nuclei exemplify the variability but still consistently interior location of reshuffled HSA19-homologous chromosome segments in this species of lesser apes in contrast to the peripherally located HSA18-homologous segments. The origin of paint probes used for each species is described in Table 1.
Figure 4
Figure 4
Scheme of 3D evaluation of radial chromosome territory arrangements in spherical cell nuclei. (for details see Materials and Methods).
Figure 5
Figure 5
Quantitative 3D evaluation of radial chromatin arrangements in primate cell nuclei with HSA18 and HSA19 homologues. Radial chromatin arrangements observed after painting with HSA18- and HSA19-homologous probes evaluated in 25 radial concentric nuclear shells (compare Fig. 4). The abscissa denotes the relative radius r of the nuclear shells, the ordinate denotes the normalized sum of the intensities in the voxels for a respective fluorochrome belonging to a given shell. For normalization, the area underlying the curve for each color (total relative DNA content) was set to 100. n = number of 3D evaluated nuclei. In all species, a highly significant difference (P < 0.001) was noted between the radial positioning of HSA18 (red) and HSA19 (green) homologous chromatin. HSA18-homologous chromosome material is consistently distributed closer to the nuclear border, whereas HSA19-homologous material is distributed toward the nuclear interior. Bars indicate standard deviations of the mean for each shell. Blue curves represent counterstained DNA.
Figure 6
Figure 6
Quantitative 3D evaluation in New World monkey species nuclei with HSA19 and HSA1q32→qter homologues. (Left) Quantitative 3D evaluation of SSC14 positioning in squirrel monkey cell nuclei after painting of SSC14p (red) with a HSA1q32→qter-homologous probe and of SSC14q (green) with a HSA19-homologous probe (compare Fig. 1). (Center and Right) Quantitative 3D evaluation after painting of separate chromosomes homologous to HSA1q32→qter (red) and HSA19 (green) homologous segments in marmoset and tamarin cell nuclei (for the description of the abscissa and the ordinate, see Fig. 5).

Similar articles

Cited by

References

    1. Chevret E, Volpi E V, Sheer D. Cytogenet Cell Genet. 2000;90:13–21. - PubMed
    1. Cremer T, Cremer C. Nat Rev Genet. 2001;2:292–301. - PubMed
    1. Cremer T, Kreth G, Koester H, Fink R H A, Heintzmann R, Cremer M, Solovei I V, Zink D, Cremer C. Crit Rev Eukaryotic Gene Expression. 2000;12:179–212. - PubMed
    1. Lamond A I, Earnshaw W C. Science. 1998;280:547–553. - PubMed
    1. Leitch A R. Microbiol Mol Biol Rev. 2000;64:138–152. - PMC - PubMed

Publication types