

The combined absence of NF-kappa B1 and c-Rel reveals that overlapping roles for these transcription factors in the B cell lineage are restricted to the activation and function of mature cells
- PMID: 11930006
- PMCID: PMC123679
- DOI: 10.1073/pnas.072071599
The combined absence of NF-kappa B1 and c-Rel reveals that overlapping roles for these transcription factors in the B cell lineage are restricted to the activation and function of mature cells
Abstract
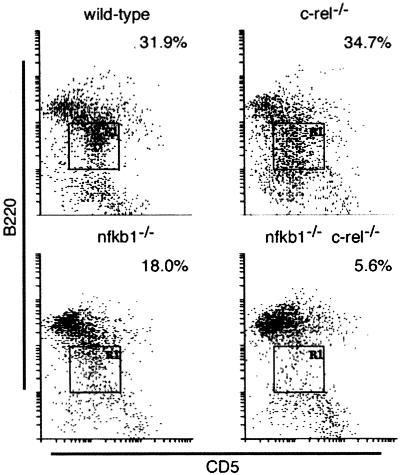
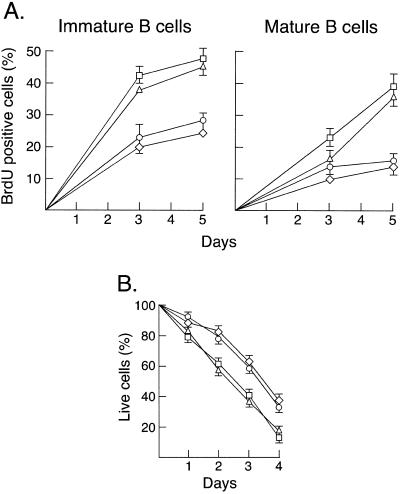
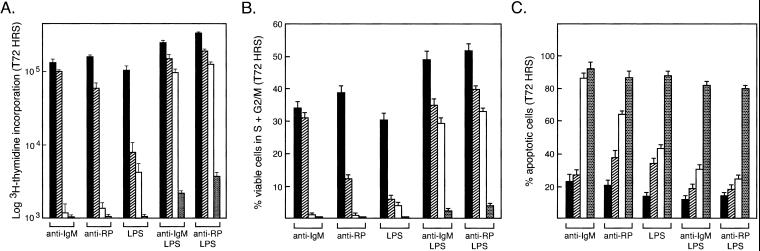
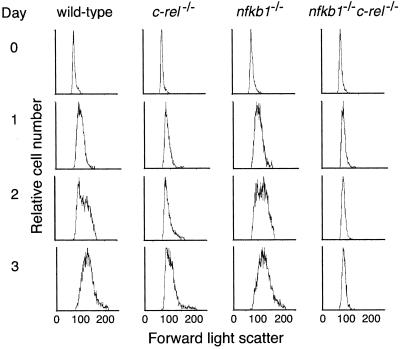
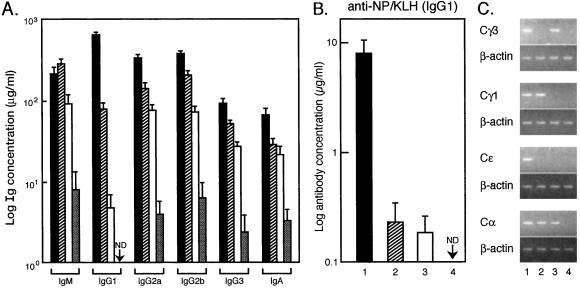
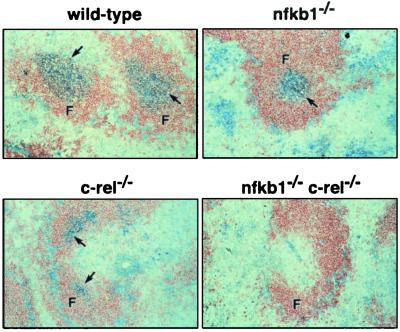
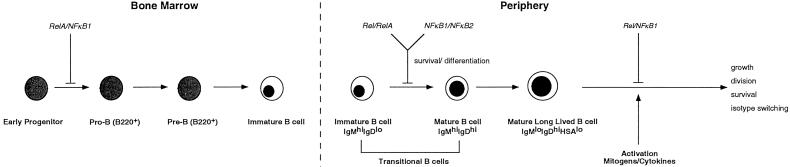
Transcription factors NF-kappaB1 and c-Rel, individually dispensable during embryogenesis, serve similar, yet distinct, roles in the function of mature hemopoietic cells. Redundancy among Rel/NF-kappaB family members prompted an examination of the combined roles of c-Rel and NF-kappaB1 by using mice that lack both proteins. Embryonic development and the maturation of hemopoietic progenitors were unaffected in nfkb1(-/-)c-rel(-/-) mice. Peripheral T cell populations developed normally, but follicular, marginal zone, and CD5(+) peritoneal B cell populations all were reduced. In culture, a failure of mitogen-stimulated nfkb1(-/-)c-rel(-/-) B cells to proliferate was caused by a cell cycle defect in early G(1) that prevented growth. In vivo, defects in humoral immunity and splenic architecture seen in nfkb1(-/-) and c-rel(-/-) mice were exacerbated in the double mutant mice. These findings demonstrate that in the B lineage overlapping roles for NF-kappaB1 and c-Rel appear to be restricted to regulating the activation and function of mature cells.
Figures
Similar articles
-
B lymphocytes differentially use the Rel and nuclear factor kappaB1 (NF-kappaB1) transcription factors to regulate cell cycle progression and apoptosis in quiescent and mitogen-activated cells.J Exp Med. 1998 Mar 2;187(5):663-74. doi: 10.1084/jem.187.5.663. J Exp Med. 1998. PMID: 9480976 Free PMC article.
-
The anti-apoptotic activities of Rel and RelA required during B-cell maturation involve the regulation of Bcl-2 expression.EMBO J. 2000 Dec 1;19(23):6351-60. doi: 10.1093/emboj/19.23.6351. EMBO J. 2000. PMID: 11101508 Free PMC article.
-
The c-Rel transcription factor and B-cell proliferation: a deal with the devil.Oncogene. 2004 Mar 25;23(13):2275-86. doi: 10.1038/sj.onc.1207410. Oncogene. 2004. PMID: 14755244 Review.
-
NF-kappa B/Rel transcription factors: c-Rel promotes airway hyperresponsiveness and allergic pulmonary inflammation.J Immunol. 1999 Dec 15;163(12):6827-33. J Immunol. 1999. PMID: 10586083
-
[The Rel/NF-kappa B transcription factors and their biological functions].Cas Lek Cesk. 2001 Mar 29;140(6):163-7. Cas Lek Cesk. 2001. PMID: 11347205 Review. Czech.
Cited by
-
Kinase RIP3 is dispensable for normal NF-kappa Bs, signaling by the B-cell and T-cell receptors, tumor necrosis factor receptor 1, and Toll-like receptors 2 and 4.Mol Cell Biol. 2004 Feb;24(4):1464-9. doi: 10.1128/MCB.24.4.1464-1469.2004. Mol Cell Biol. 2004. PMID: 14749364 Free PMC article.
-
NF-kappaB1 and c-Rel cooperate to promote the survival of TLR4-activated B cells by neutralizing Bim via distinct mechanisms.Blood. 2008 Dec 15;112(13):5063-73. doi: 10.1182/blood-2007-10-120832. Epub 2008 Sep 19. Blood. 2008. PMID: 18805964 Free PMC article.
-
The NF-κB1 transcription factor prevents the intrathymic development of CD8 T cells with memory properties.EMBO J. 2012 Feb 1;31(3):692-706. doi: 10.1038/emboj.2011.435. Epub 2011 Nov 29. EMBO J. 2012. PMID: 22124325 Free PMC article.
-
Yolk sac-derived Pdcd11-positive cells modulate zebrafish microglia differentiation through the NF-κB-Tgfβ1 pathway.Cell Death Differ. 2021 Jan;28(1):170-183. doi: 10.1038/s41418-020-0591-3. Epub 2020 Jul 24. Cell Death Differ. 2021. PMID: 32709934 Free PMC article.
-
Emu-BCL10 mice exhibit constitutive activation of both canonical and noncanonical NF-kappaB pathways generating marginal zone (MZ) B-cell expansion as a precursor to splenic MZ lymphoma.Blood. 2009 Nov 5;114(19):4158-68. doi: 10.1182/blood-2008-12-192583. Epub 2009 Aug 20. Blood. 2009. PMID: 19696203 Free PMC article.
References
-
- Gilmore T D, Koedood M, Piffat K A, White D W. Oncogene. 1996;13:1367–1378. - PubMed
-
- Ghosh S, May M J, Kopp E B. Annu Rev Immunol. 1998;16:225–260. - PubMed
-
- Karin M. Oncogene. 1999;18:6867–6874. - PubMed
-
- Gerondakis S, Grossmann M, Nakamura Y, Pohl T, Grumont R J. Oncogene. 1999;18:6888–6895. - PubMed
-
- Gerondakis S, Grumont R, Rourke I, Grossmann M. Curr Opin Immunol. 1998;10:353–359. - PubMed
Publication types
MeSH terms
Substances
LinkOut - more resources
Full Text Sources
Molecular Biology Databases
Miscellaneous
