

Mapping the evolution of regional atrophy in Alzheimer's disease: unbiased analysis of fluid-registered serial MRI
- PMID: 11930016
- PMCID: PMC123711
- DOI: 10.1073/pnas.052587399
Mapping the evolution of regional atrophy in Alzheimer's disease: unbiased analysis of fluid-registered serial MRI
Abstract
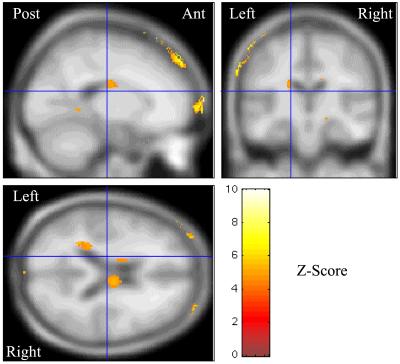
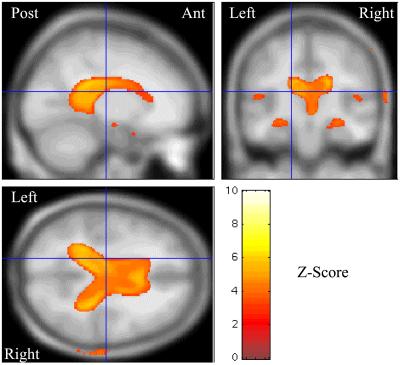
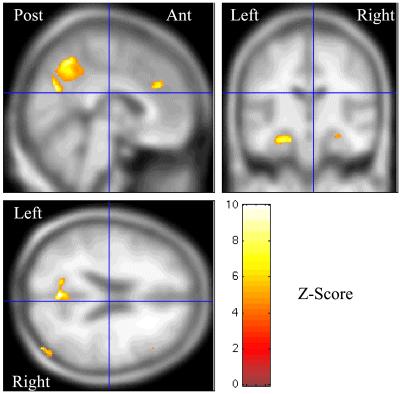
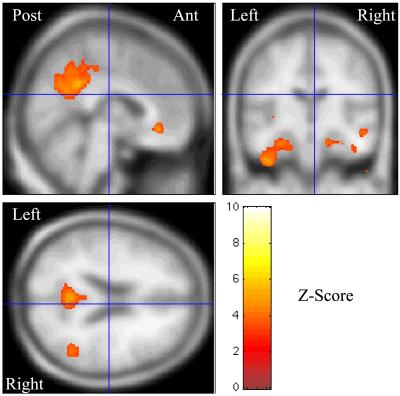
Alzheimer's disease (AD) is characterized by progressive cerebral atrophy, which may be assessed by using volumetric MRI. We describe a voxel-based analysis of nonlinear-registered serial MRI to demonstrate the most statistically significant (P < 0.001) regions of change at different stages of the disease. We compared presymptomatic (n = 4), mild (n = 10), and moderately affected (n = 12) patients with early- and late-onset AD, with age- and sex-matched controls, and demonstrated increasing global atrophy with advancing disease. Significantly increased rates of hippocampal atrophy were seen in presymptomatic and mildly affected patients. There was a shift in the distribution of temporal lobe atrophy with advancing disease; the inferolateral regions of the temporal lobes showed the most significantly increased rates of atrophy by the time the patients were mildly or moderately affected. Significantly increased rates of medial parietal lobe atrophy were seen at all stages, with frontal lobe involvement occurring later in the disease. Our results suggest that the sites showing the most significant rates of atrophy alter as the disease advances, and that regional atrophy is already occurring before the onset of symptoms. This technique provides insights into the natural history of AD, and may be a valuable tool in assessing the efficacy of disease-modifying treatments, especially if these treatments were to have region-specific effects.
Figures


Comment in
-
Imaging the progression of Alzheimer pathology through the brain.Proc Natl Acad Sci U S A. 2002 Apr 2;99(7):4135-7. doi: 10.1073/pnas.082107399. Proc Natl Acad Sci U S A. 2002. PMID: 11929987 Free PMC article. No abstract available.
References
Publication types
MeSH terms
Grants and funding
LinkOut - more resources
Full Text Sources
Other Literature Sources
Medical
