Review
. 2002 Apr;15(2):223-46.
doi: 10.1128/CMR.15.2.223-246.2002.

Dracunculiasis (Guinea worm disease) and the eradication initiative

Affiliations
Review

Dracunculiasis (Guinea worm disease) and the eradication initiative

Sandy Cairncross et al. Clin Microbiol Rev. 2002 Apr.

Abstract

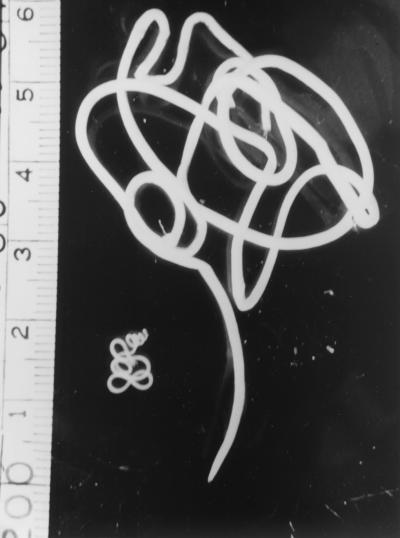
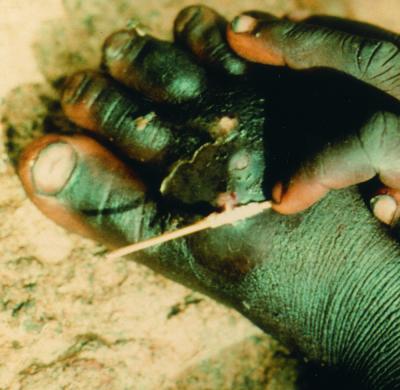
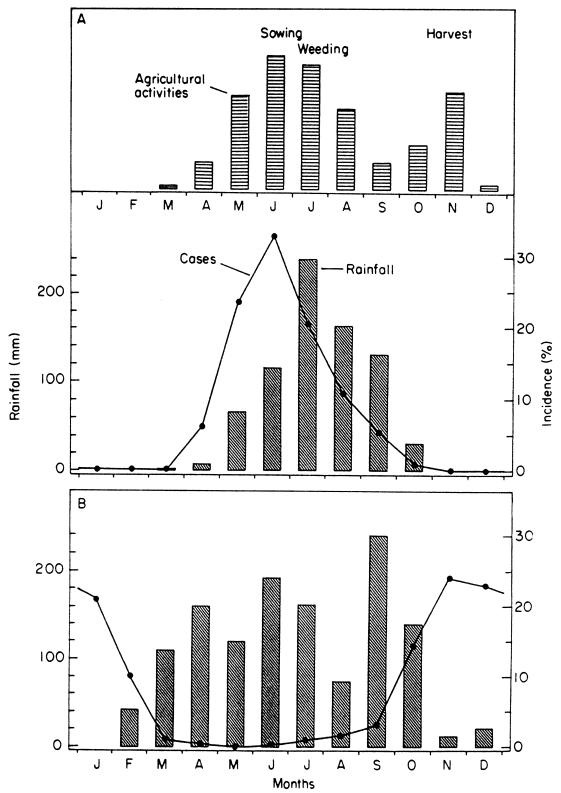
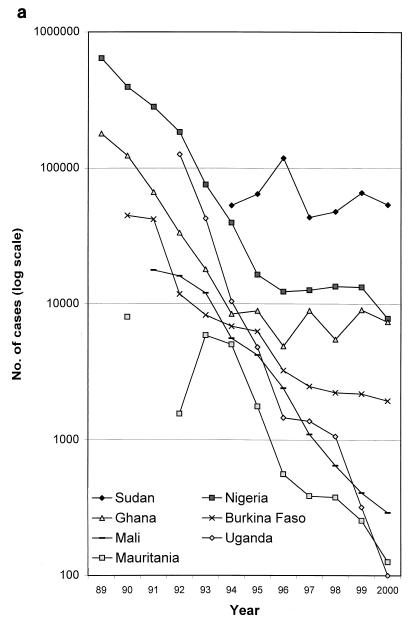
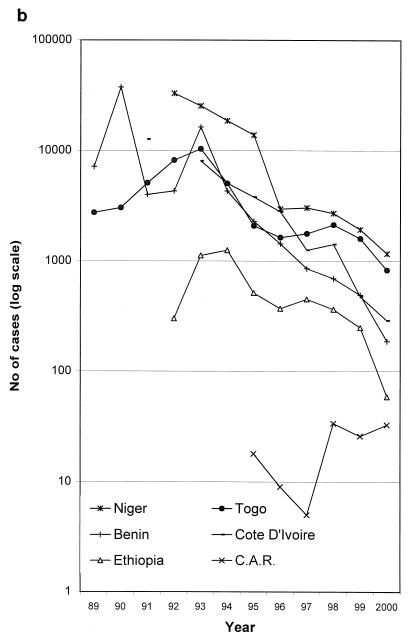
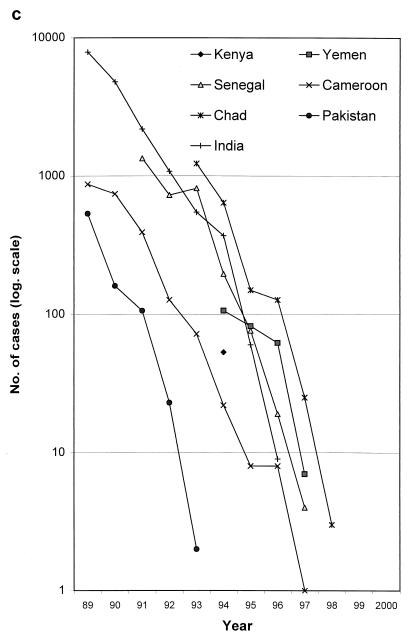
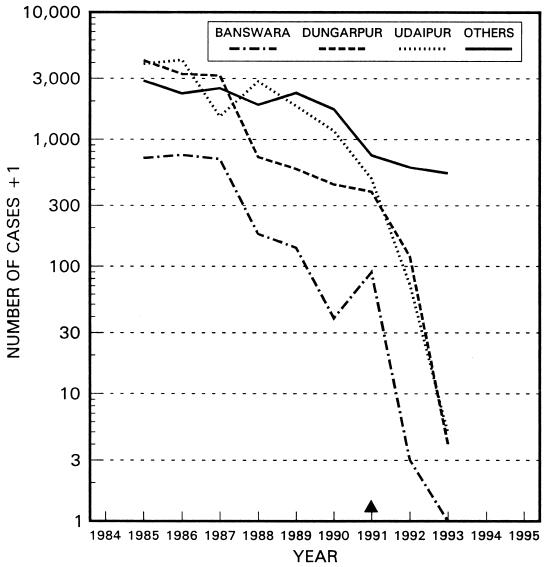
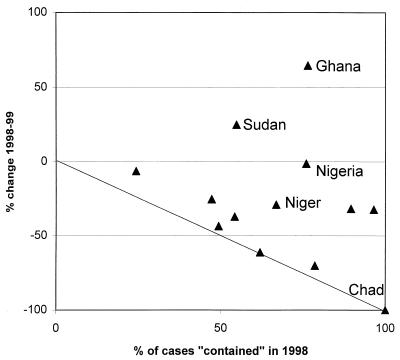
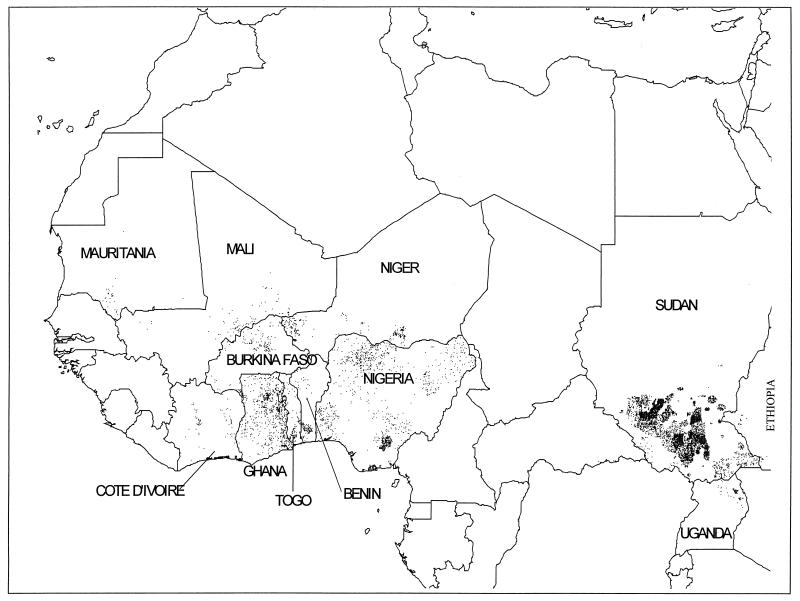
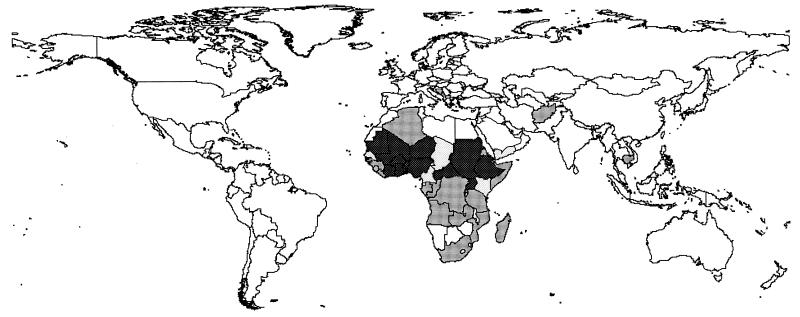
Dracunculiasis, also known as guinea worm disease, is caused by the large female of the nematode Dracunculus medinensis, which emerges painfully and slowly from the skin, usually on the lower limbs. The disease can infect animals, and sustainable animal cycles occur in North America and Central Asia but do not act as reservoirs of human infection. The disease is endemic across the Sahel belt of Africa from Mauritania to Ethiopia, having been eliminated from Asia and some African countries. It has a significant socioeconomic impact because of the temporary disability that it causes. Dracunculiasis is exclusively caught from drinking water, usually from ponds. A campaign to eradicate the disease was launched in the 1980s and has made significant progress. The strategy of the campaign is discussed, including water supply, health education, case management, and vector control. Current issues including the integration of the campaign into primary health care and the mapping of cases by using geographic information systems are also considered. Finally, some lessons for other disease control and eradication programs are outlined.


Figures

FIG. 1.
FIG. 1.
Male and female D. medinensis worms. The female worm is the larger of the two. The ruler at the left is in centimeters.
FIG. 2.
FIG. 2.
Development of Dracunculus in the mammalian host. S.C.CONN., subcutaneous connective tissues. Sizes at left are given in centimeters.
FIG. 3.
FIG. 3.
A human case of guinea worm disease, with an emerging worm. The worm is often wound on a stick, a practice which is believed to have given rise to the caduceus symbol of medicine. (Copyright A. Tayeh.)
FIG. 4.
FIG. 4.
Guinea worm in a laboratory cat infected with cyclops from a pond in Nigeria.
FIG. 5.
FIG. 5.
Prevalence of dracunculiasis in people and dogs in Old Bukhara, Uzbekistan, 1926 to 1931. Data are from reference .
FIG. 6.
FIG. 6.
Seasonality of dracunculiasis in the Sahel (A) and the forest zone of West Africa (B), compared with the rainfall and the Sahel's seasonal pattern of agricultural labor demand. Reproduced from reference with permission of Taylor & Francis Ltd. Months are January, February, March, April, May, June, July, August, September, October, November, and December, from left to right, respectively.
FIG. 7.
FIG. 7.
Age prevalence curves for 4 high-endemicity and 23 lower-endemicity villages in South Kordofan, Sudan. The curves were plotted from data in reference .
FIG. 8.
FIG. 8.
The decline in cases of guinea worm disease by country and by year, 1989 to 2000. Note the logarithmic vertical scale. (a) Selected countries of endemicity. The poor performances of Sudan, due to the civil war, and of Ghana and Nigeria in the late 1990s can be seen. (b) The remaining countries of endemicity. The rise in cases in the initial years of some national programs (e.g., Togo and Ethiopia) is attributable to gradual improvements in case detection. C.A.R., Central African Republic. (c) The countries which have interrupted transmission; the last point shown for each country is for the last year in which autochthonous cases were reported. Data are courtesy of WHO.
FIG. 8.
FIG. 8.
The decline in cases of guinea worm disease by country and by year, 1989 to 2000. Note the logarithmic vertical scale. (a) Selected countries of endemicity. The poor performances of Sudan, due to the civil war, and of Ghana and Nigeria in the late 1990s can be seen. (b) The remaining countries of endemicity. The rise in cases in the initial years of some national programs (e.g., Togo and Ethiopia) is attributable to gradual improvements in case detection. C.A.R., Central African Republic. (c) The countries which have interrupted transmission; the last point shown for each country is for the last year in which autochthonous cases were reported. Data are courtesy of WHO.
FIG. 9.
FIG. 9.
Decline in guinea worm cases from 1985 to 1993 in three districts of Rajasthan State, India, where surgical extraction was practiced from 1991 onward. The total of cases for all other districts in the state is also shown. Information provided by UNICEF.
FIG. 10.
FIG. 10.
Case containment: proportion of cases contained in 1998 and year-on-year national case reductions from 1998 to 1999 for countries of endemicity in Africa. Each point on the graph represents one country's performance.
FIG. 11.
FIG. 11.
Spot map of Africa showing villages of endemicity in 1999. Note that for Nigeria, Sudan, and Ghana, for which full village mapping data do not exist, villages are distributed randomly according to the administrative level and not their exact positions. Data courtesy of WHO Healthmap.
FIG. 12.
FIG. 12.
Global status of certification of Dracunculus eradication as of the fourth meeting of the ICCDE, in February 2000. Countries and territories marked by white space are certified to be free of transmission, those with pale gray shading are under precertification surveillance, those with medium gray shading are not yet certified, and those with dark shading are countries of endemicity (reporting indigenous cases in 1999).

References

    1. Abolarin, M. O. 1981. Guinea worm infection in a Nigerian village. Trop. Geogr. Med 33:83-88. - PubMed
    1. Adamson, P. 1988. Dracontiasis in antiquity. Med. Hist 32:204-209. - PMC - PubMed
    1. Adekolu-John, E. A. 1983. The impact of lake creation on guinea-worm transmission in Nigeria on the Eastern side of Kainji Lake. Int. J. Parasitol 13:427-432. - PubMed
    1. Adeyeba, O. A. 1985. Secondary infection in dracunculiasis: bacteria and morbidity. Int. J. Zoonoses 12:147-149. - PubMed
    1. Adeyeba, O. A., and O. O. Kale. 1991. Epidemiology of dracunculiasis and its socio-economic impact in a village in south-west Nigeria. West Afr. J. Med 10:208-215. - PubMed

LinkOut - more resources