

Multifocal electroretinogram: age-related changes for different luminance levels
- PMID: 11935277
- PMCID: PMC2570348
- DOI: 10.1007/s00417-002-0442-6
Multifocal electroretinogram: age-related changes for different luminance levels
Abstract
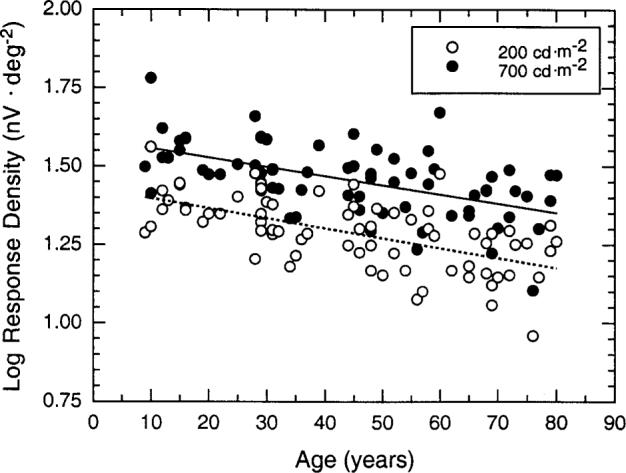
Background: Age-related changes in the first-order multifocal electroretinogram (mfERG) responses were measured for two different luminance levels (200 and 700 cd.m(-2)). The relative contribution of optical and neural factors to senescent change in response was evaluated.
Methods: Data were obtained from one eye of each of 71 normal phakic subjects, age 9-80 years. The mfERG responses were recorded with the 7" stimulus-refractor unit (EDI) and VERIS 4.3 using the following protocol: bipolar contact lens, 103 hexagons, consecutive stimulation with 200 and 700 cd.m(-2), pupils > or =6 mm, amplification of 10(5), filter cut-offs at 10 and 300 Hz.
Results: Age-correlated decreases in amplitude and response density and increases in P1 implicit time were found for both luminance levels. The mean response density (nV.deg(-2)) was higher for the 700 cd.m(-2) stimulus, but the rate of change with age was not significantly different from that obtained with the 200 cd.m(-2) stimulus. Implicit time was not significantly different for the two light levels, nor was the rate of change with age. The decrease in response density and the increase in implicit time with age were significant across all retinal regions, dividing the 50 deg stimulus into six concentric rings. Age-related change in response density was greatest for the central retina and decreased with increasing retinal eccentricity.
Conclusion: Log mfERG response changes linearly as a function of age. Analyses of the effects of reduced ocular media transmission and increased stray light, along with ancillary data obtained from pseudophakes, imply that age-related changes in the mfERG are due to both optical and neural factors.
Figures


References
-
- Anzai K, Mori K, Murayama K, Yoneya S. Normal values and their variation with age in multifocal electroretinograms. Invest Ophthalmol Vis Sci. 1997;38:S881.
-
- Birch DG, Anderson JL. Standardized full-field electroretinography. Normal values and their variation with age. Arch Ophthalmol. 1992;110:1571–1576. - PubMed
-
- Brown B, Yap MKH. Contrast and luminance as parameters defining the output of the VERIS topographical ERG. Ophthalmic Physiol Opt. 1996;16:42–48. - PubMed
-
- Curcio CA, Millican CL, Allen KA, Kalina RE. Aging of the human photoreceptor mosaic: evidence for selective vulnerability of rods in central retina. Invest Ophthalmol Vis Sci. 1993;34:3278–3296. - PubMed
-
- Fortune B, Johnson CA. The decline of photopic multifocal electroretinogram responses with age is primarily due to pre-retinal optical factors. J Opt Soc Am A. 2002;19:173–184. - PubMed
