. 2002 May;22(9):3053-65.
doi: 10.1128/MCB.22.9.3053-3065.2002.

Initiation sites are distributed at frequent intervals in the Chinese hamster dihydrofolate reductase origin of replication but are used with very different efficiencies

Affiliations

Initiation sites are distributed at frequent intervals in the Chinese hamster dihydrofolate reductase origin of replication but are used with very different efficiencies

Pieter A Dijkwel et al. Mol Cell Biol. 2002 May.

Abstract

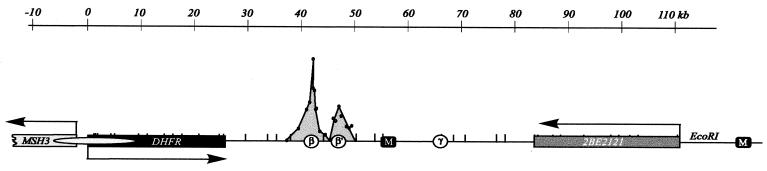
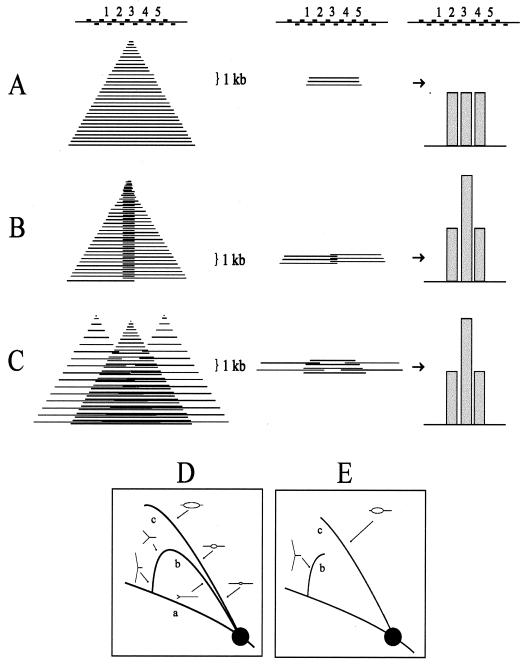
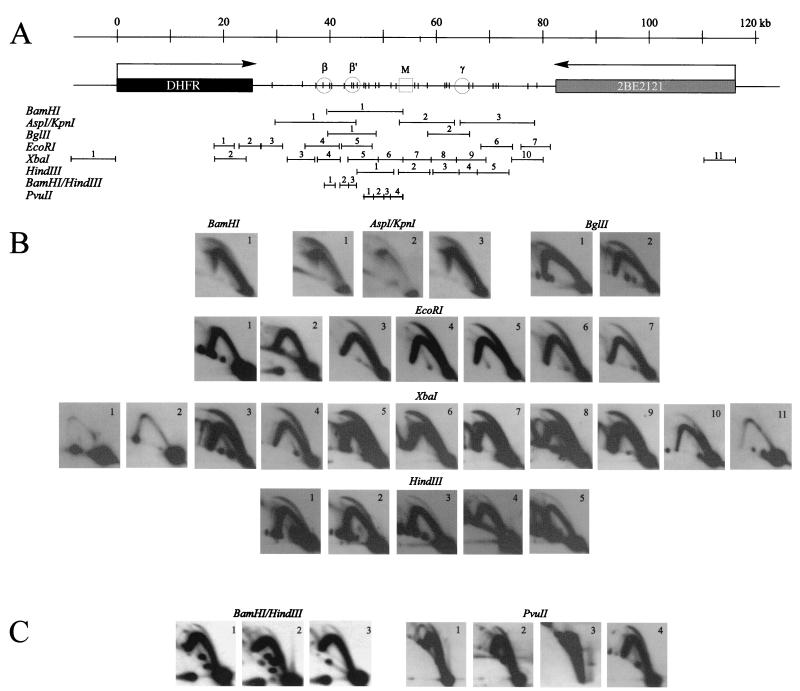
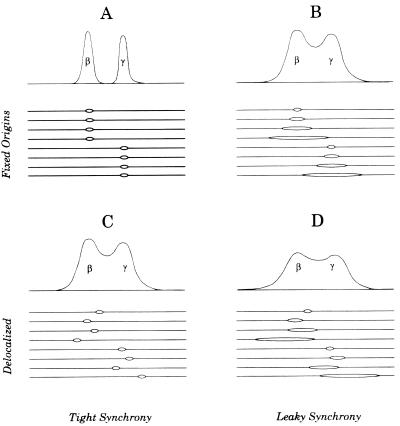
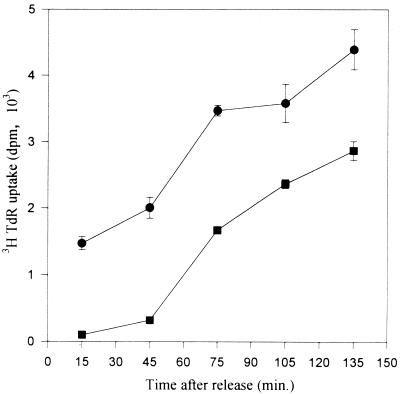
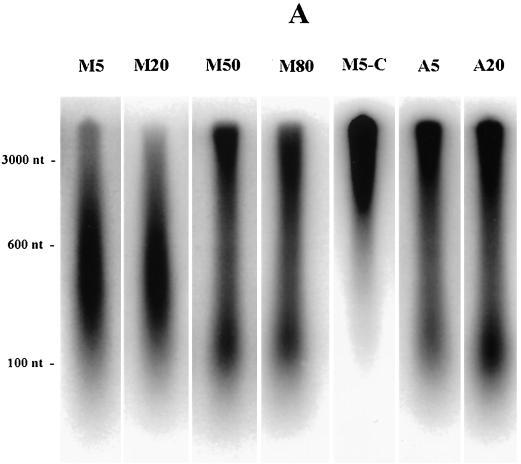
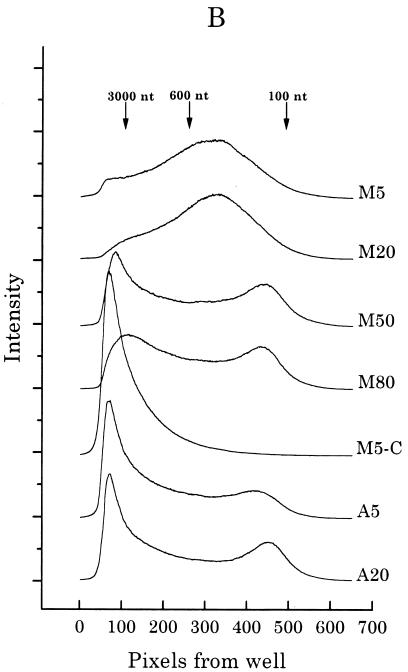
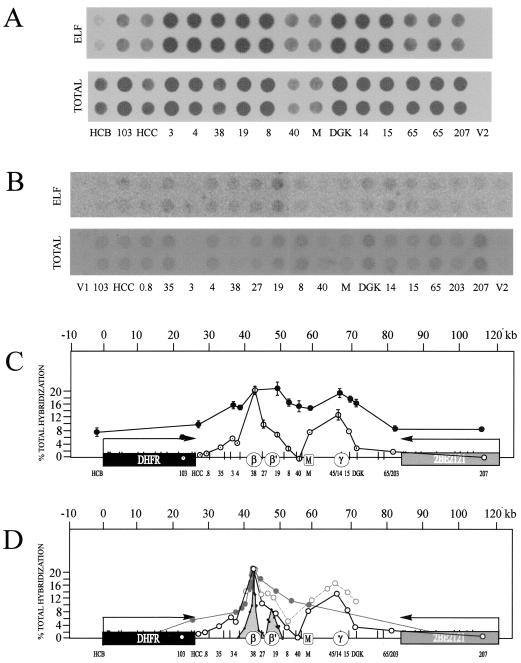
Previous radiolabeling and two-dimensional (2-D) gel studies of the dihydrofolate reductase (DHFR) domain of Chinese hamster cells have suggested that replication can initiate at any one of a very large number of inefficient sites scattered throughout the 55-kb intergenic spacer region, with two broad subregions (ori-beta and ori-gamma) preferred. However, high-resolution analysis by a PCR-based nascent strand abundance assay of the 12-kb subregion encompassing ori-beta has suggested the presence of a relatively small number of fixed, highly efficient initiation sites distributed at infrequent intervals that correspond to genetic replicators. To attempt to reconcile these observations, two different approaches were taken in the present study. In the first, neutral-neutral 2-D gel analysis was used to examine replication intermediates in 31 adjacent and overlapping restriction fragments in the spacer, ranging in size from 1.0 to 18 kb. Thirty of 31 fragments displayed the complete bubble arcs characteristic of centered origins. Taking into account overlapping fragments, these data suggest a minimum of 14 individual start sites in the spacer. In the second approach, a quantitative early labeled fragment hybridization assay was performed in which radioactive origin-containing DNA 300 to 1,000 nucleotides in length was synthesized in the first few minutes of the S period and used to probe 15 clones distributed throughout the intergenic spacer but separated on average by more than 1,000 bp. This small nascent DNA fraction hybridized to 14 of the 15 clones, ranging from just above background to a maximum at the ori-beta locus. The only silent region detected was a small fragment lying just upstream from a centered matrix attachment region--the same region that was also negative for initiation by 2-D gel analysis. Results of both approaches suggest a minimum of approximately 20 initiation sites in the spacer (two of them being ori-beta and ori-gamma), with ori-beta accounting for a maximum of approximately 20% of initiations occurring in the spacer. We believe that the results of all experimental approaches applied to this locus so far can be fitted to a model in which the DHFR origin consists of a 55-kb intergenic zone of potential sites that are used with very different efficiencies and which are separated in many cases by a few kilobases or less.


Figures

FIG. 1.
FIG. 1.
Map of the Chinese hamster DHFR locus. An EcoRI map of a 120-kb region encompassing the DHFR locus in CHOC 400 cells is shown. The convergently transcribed DHFR and 2BE2121 genes are indicated as rectangular boxes, ori-β, ori-β′, and ori-γ are shown as open circles, and a prominent MAR (M) is shown as a black square. The elongated gray oval over the DHFR promoter indicates a diffuse region that appears to be attached to the nuclear matrix as well. The peaks detected at ori-β, ori-β′, and ori-γ by the PCR-based small nascent strand abundance assay are based on results shown in reference .
FIG. 2.
FIG. 2.
Predictions of the relative abundances of nascent strands with different origin types. As shown in panel A (left), if origin-containing nascent strands in the size range of ∼1,000 nt are analyzed with a series of primer pairs that are positioned within a 1,000-bp stretch, then the three central primer sets (sets 2, 3, and 4) should each detect the same relative abundance of ∼1,000-bp nascent strands (middle and right). The sharp peaks of small nascent strands that were actually measured with closely spaced primer pairs (31) could result from two alternative types of initiation mechanism (unidirectional from a fixed site) (B) or in a cluster of sites within a small region (C). (D) A restriction digest of replication intermediates separated in the first dimension of an agarose gel according to molecular mass and in the second dimension according to both mass and shape (3). After transfer to a membrane and hybridization with a cognate probe for a fragment containing either a single fork or a centered bubble arc (curves b or c) would be obtained. Curve a corresponds to the diagonal of nonreplicating fragments in the genome as a whole. (E) The pattern that would result from a fragment that contains an off-centered origin, which would initially contribute to the bubble arc, but would eventually contribute to the single fork arc when one fork crosses the nearest restriction site.
FIG. 3.
FIG. 3.
Centered bubble arcs are detected in 30 of 31 adjacent and overlapping restriction fragments in the intergenic region. CHOC 400 cells were arrested in early G1 by isoleucine starvation, followed by release into either 400 μM mimosine or 10-μg/ml aphidicolin for 12 h. At 90 or 30 min after release, respectively, which are the peak initiation periods in this locus after each of these protocols (11, 15), replication intermediates were prepared using one of the enzymes or enzyme combinations shown in panel A. After separation on a neutral-neutral 2-D gel as described in Materials and Methods, digests were blotted onto Hybond-N+ and hybridized as described previously (14) with small cognate single-copy probes for the indicated fragments. (B) Digests yielding fragments in the 3- to 18-kb range. (C) BamHI/HindIII and PvuII digests yielding a collection of small fragments that together almost reconstitute the 15-kb fragment 1 of BamHI that extends from ori-β to the MAR (A).
FIG. 4.
FIG. 4.
Expected patterns of nascent strands after release from a leaky or a nonleaky replication inhibitor with fixed and delocalized origins. To discriminate between two fixed origins at, for example, ori-β and ori-γ versus a delocalized zone with ori-β and ori-γ preferred, it would be necessary to label cells or allow forks to mature for a very short time after release from a very tight G1/S arrest (A and C). If replication forks leak away from origins in the presence of the synchronizing agent, the patterns of labeling would be very similar between the fixed and delocalized initiation modes (B and D).
FIG. 5.
FIG. 5.
There is a lag after release from mimosine before CHOC 400 cells begin to incorporate [3H]thymidine into DNA. CHOC 400 cells growing in 24-well dishes were starved for isoleucine for 45 h and were released for 12 h into either 400 μM mimosine (squares) or 10-μg/ml (29.5 μM) aphidicolin (circles). The drugs were washed out with prewarmed drug-free medium and cultures were incubated in complete MEM. At 30-min intervals beginning at time zero, quadruplicate wells were pulse labeled with 5-μCi/ml [3H]thymidine for 30 min. Incorporation was quenched by the addition of citric acid to 0.2 M (43), and specific labeling of DNA was determined as previously described (42). Data are plotted at the midpoint of the pulse period. Bars indicate standard errors of the mean of quadruplicate samples.
FIG. 6.
FIG. 6.
Mimosine-synchronized cells begin synthesizing DNA immediately from sites very close to origins after permeabilization in the presence of dNTPs. (A) CHOC 400 cells were arrested near the G1/S boundary in either 400 μM mimosine or 10-μg/ml aphidicolin, washed with prewarmed drug-free medium, and then incubated in drug-free complete medium (for 5, 20, 50, or 80 min after mimosine removal or for 5 and 20 min after aphidicolin removal) prior to harvesting and isolation of nuclei as described in Materials and Methods. In vitro replication assays were carried out for 1.5 min at 34°C and quenched; one 5-min mimosine-synchronized sample was chased for an additional 30 min in vitro with 100 μM dCTP (lane M5-C). The DNA was then purified as described in Materials and Methods and was separated with an alkaline agarose gel (1.8%) along with a 123-bp ladder (BRL). The gel was transferred to Hybond-N+ and analyzed with the PhosphorImager. (B) Each lane shown in panel A was quantitated as a line graph using an ImageQuant program (the same length and width were scanned in each case), and radioactivity (expressed as relative intensity units) was plotted as a function of distance from the well. The scans are juxtaposed in the figure to allow comparison among samples.
FIG. 6.
FIG. 6.
Mimosine-synchronized cells begin synthesizing DNA immediately from sites very close to origins after permeabilization in the presence of dNTPs. (A) CHOC 400 cells were arrested near the G1/S boundary in either 400 μM mimosine or 10-μg/ml aphidicolin, washed with prewarmed drug-free medium, and then incubated in drug-free complete medium (for 5, 20, 50, or 80 min after mimosine removal or for 5 and 20 min after aphidicolin removal) prior to harvesting and isolation of nuclei as described in Materials and Methods. In vitro replication assays were carried out for 1.5 min at 34°C and quenched; one 5-min mimosine-synchronized sample was chased for an additional 30 min in vitro with 100 μM dCTP (lane M5-C). The DNA was then purified as described in Materials and Methods and was separated with an alkaline agarose gel (1.8%) along with a 123-bp ladder (BRL). The gel was transferred to Hybond-N+ and analyzed with the PhosphorImager. (B) Each lane shown in panel A was quantitated as a line graph using an ImageQuant program (the same length and width were scanned in each case), and radioactivity (expressed as relative intensity units) was plotted as a function of distance from the well. The scans are juxtaposed in the figure to allow comparison among samples.
FIG. 7.
FIG. 7.
A high-resolution ELFH assay performed with mimosine-synchronized cells suggests that potential initiation sites are distributed at intervals of 1,000 bp or less. (A) Mimosine-synchronized cells were permeabilized and incubated for 1.5 min in vitro as described in Materials and Methods. The DNA was purified, sonicated to ∼600 bp in length, and utilized as a hybridization probe on a series of clones from the DHFR domain (or the pBS and pGem cloning vectors V1 and V2, respectively) that had been dotted onto a nylon filter in a total volume of 5 μl. A duplicate dot blot was hybridized with total CHOC 400 DNA that was sonicated to about 600 bp and labeled with [32P]dCTP as previously described (57). After being hybridized and washed, the filters were exposed to the PhosphorImager. (B) Conditions were the same as described for panel A, except that after purification, the DNA was treated with alkali, separated on an alkaline agarose gel, and the 300- to 1,000-nt fraction was isolated and used to probe a similar series of duplicate clones spotted onto a nylon membrane. (Clone DGK was incorrectly spotted out of linear order on the blots shown in panels A and B relative to its map position and should have been placed between clones 15 and 65.) (C) The percentage of total hybridization specific to each clone was calculated as described in Materials and Methods. The relative radioactivities in duplicate dots were plotted as a function of map position for each clone. Error bars indicate the standard error of the mean of four independent experiments for the total labeled probe shown in panel A (measured by two people independently; filled circles) or for the same experiment shown in panel B (measured by two individuals; open circles). (D) The results from the sized ELFH experiment pictured in panel C and from a previous PCR-based analysis of small nascent strands (31) (grey peaks). Data are also presented from an earlier experiment that measured the intrinsic labeling pattern in the first 30 min of the S period in CHOC 400 cells by an in-gel renaturation procedure (36), indicated by the grey curve with open circles, as well as the data from an earlier low-resolution ELFH experiment with aphidicolin-synchronized cells that lacked indicator clones in the region of ori-γ (19).

References

    1. Abdurashidova, G., M. Deganuto, R. Klima, S. Riva, G. Biamonti, M. Giacca, and A. Falaschi. 2000. Start sites of bidirectional DNA synthesis at the human lamin B2 origin. Science 287:2023-2026. - PubMed
    1. Altman, A. L., and E. Fanning. 2001. The Chinese hamster dihydrofolate reductase replication origin beta is active at multiple ectopic chromosomal locations and requires specific DNA sequence elements for activity. Mol. Cell. Biol. 21:1098-1110. - PMC - PubMed
    1. Bielinsky, A. K., and S. A. Gerbi. 1998. Discrete start sites for DNA synthesis in the yeast ARS1 origin. Science 279:95-98. - PubMed
    1. Brewer, B. J., and W. L. Fangman. 1987. The localization of replication origins on ARS plasmids in S. cerevisiae. Cell 51:463-471. - PubMed
    1. Burhans, W. C., L. T. Vassilev, M. S. Caddle, N. H. Heintz, and M. L. DePamphilis. 1990. Identification of an origin of bidirectional DNA replication in mammalian chromosomes. Cell 62:955-965. - PubMed

Publication types

LinkOut - more resources