. 2002 Apr 15;22(8):3061-9.
doi: 10.1523/JNEUROSCI.22-08-03061.2002.

ADP and AMP induce interleukin-1beta release from microglial cells through activation of ATP-primed P2X7 receptor channels

Affiliations

ADP and AMP induce interleukin-1beta release from microglial cells through activation of ATP-primed P2X7 receptor channels

Yassar Chakfe et al. J Neurosci. .

Abstract

P2X(7) is a subtype of ATP-gated channels that is highly expressed in astrocytes, microglia, and other immune cells. Activation of P2X(7) purinoceptors by ATP or 3'-O-(4-benzoyl)-benzoyl ATP (BzATP) induces the formation of cytolytic pores and provokes release of interleukin-1beta from immune cells. We investigated the actions of other endogenous nucleotides on recombinant and microglial P2X(7) receptors using electrophysiology, fluorescence imaging, and interleukin-1beta release measurement. We found that initial application of ADP or AMP to Xenopus oocytes expressing P2X(7) receptors was ineffective. However, when ADP and AMP, but not UTP or adenosine, were applied after a brief exposure to ATP or BzATP, they activated P2X(7) receptors in a dose-dependent manner. Moreover, responses to ADP and AMP were also elicited after exposure to low concentrations of ATP and were recorded several minutes after removal of ATP from the extracellular medium. Whole-cell recordings from mouse microglial cells showed that significant responses to ADP and AMP were elicited only after ATP application. YO-PRO-1 dye uptake imaging revealed that, unlike ATP, prolonged application of ADP or AMP did not cause an opening of large cytolytic pores in mouse microglial cells. Finally, ADP and AMP stimulated the release of interleukin-1beta from ATP-primed mouse and human microglial cells. We conclude that selective sensitization of P2X(7) receptors to ADP and AMP requires priming with ATP. This novel property of P2X(7) leads to activation by ATP metabolites and proinflammatory cytokine release from microglia without cytotoxicity.


Figures
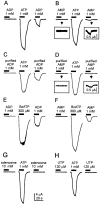
Fig. 1.
Fig. 1.
Actions of nucleotides and adenosine on recombinant mouse P2X7 receptors. Representative current responses from mP2X7-expressing oocytes to application of different nucleotides or adenosine before and after application of ATP (1 mm) or BzATP (300 μm) are shown. Responses to 1 mm ADP (A), 1 mm AMP (B), 1 mm hexokinase-purified ADP (C), 1 mm apyrase-purified AMP (D), 10 mm adenosine (G), or 120 μm UTP (H) before and after ATP are indicated. The response to 1 mm ADP (E) or 1 mm AMP (F) before and after BzATP is also shown. Drugs were applied for 10 sec (solid bars) at 1 min intervals.
Fig. 2.
Fig. 2.
Actions of ADP and AMP on rat P2X7 and rat P2X2 receptor channels. Current responses from oocytes expressing rat P2X7 to 1 mm ADP (A) and 10 mm AMP (B) before and after 500 μm ATP are shown. Current responses from oocytes expressing rat P2X2to 100 μm ADP (C) and 500 μm AMP (D) before and after 50 μm ATP are also shown. Right panels ofA–D, Relative amplitude (mean ± SEM) of ADP- and AMP-induced current during initial (1) and subsequent (2) application. *p < 0.05.
Fig. 3.
Fig. 3.
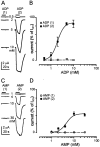
Dose–response relationship of ADP and AMP on mouse P2X7 receptors. A, Current responses of mP2X7-expressing oocytes to different concentrations of ADP before (1) and after (2) application of 1 mm ATP.B, Normalized dose–response curves of ADP-evoked current before (open squares) and after (filled squares) application of 1 mmATP. The solid line is a nonlinear regression through data points using the three-parameter logistic equation (nH = 2.87 ± 0.49;r = 0.99); the dashed line is a straight line through data points. C, Current responses of mP2X7-expressing oocytes to different concentrations of AMP before (1) and after (2) application of 1 mm ATP. D, Normalized dose–response curves of AMP-evoked current before (open circles) and after (filled circles) application of 1 mm ATP. The solid line is a nonlinear regression using the three-parameter logistic equation (nH = 2.79 ± 1.58;r = 0.98). The dashed line is a straight line through data points. Note the absence of a dose–response relationship for ADP or AMP before ATP application. Drugs were applied for 10 sec at 1 min intervals.
Fig. 4.
Fig. 4.
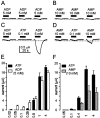
ATP primes mouse P2X7 receptors for subsequent applications of ADP and AMP. Representative current responses from two mP2X7-expressing oocytes to repeated application of 5 mm ADP (A) or 10 mm AMP (B) are shown. Note the absence of enhancement of the nucleotide-evoked current amplitude. Responses to 5 mm ADP (C) or 10 mm AMP (D) before and after application of 100 μm ATP in mP2X7-expressing oocytes are also shown. Peak response to initial drug application is indicated by dashed lines. E, Current amplitude (mean ± SEM) of ADP (5 mm; open bars) paired with the corresponding preceding ATP-evoked current (solid bars) at different concentrations (in mm, numbers below solid bars).F, Current amplitude (mean ± SEM) of AMP (10 mm; gray bars) paired with the corresponding ATP-evoked priming current (solid bars) at different concentrations (in mm, numbers below solid bars).
Fig. 5.
Fig. 5.
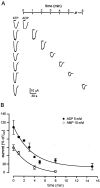
Time course of ATP priming on mouse P2X7 receptors. A, Recordings from mP2X7-expressing oocytes showing current responses to 5 mm ADP applied at different intervals after 1 mm ATP application. B, Normalized ADP-evoked currents (mean ± SEM, solid circles) and AMP-evoked currents (mean ± SEM, open circles) represented as percentage of ATP-induced current (IATP) at different times after ATP application. Solid lines are monoexponential fits with τ = 3.4 min, r = 0.98 and τ = 3.2 min, r = 0.99 for ADP and AMP, respectively.
Fig. 6.
Fig. 6.
ATP primes N9 mouse microglial cells for ADP and AMP. A, Patch-clamp recording from one N9 cell showing typical current responses to 5 mm ADP applied 1 min before and 1 min after application of 1 mm ATP. B, Relative amplitude (mean ± SEM) of ADP-evoked currents corresponding to initial (1) and subsequent (2) applications of ADP. C, Current responses from another N9 cell to 10 mm AMP before and after 1 mm ATP. The histogram in D shows normalized AMP-evoked currents (mean ± SEM) in response to initial (1) and subsequent (2) application of AMP. *p < 0.05.
Fig. 7.
Fig. 7.
ADP and AMP do not induce permeabilization of N9 microglial cells. Bar histograms of the mean (± SEM)ΔF/F0 YO-PRO uptake in response to different nucleotides in low divalent (A) and in high divalent (B) solutions are shown. Data are reported at 25 min. pAMP andpADP indicate that cells were primed with ATP for 10 sec and then washed for 1 min before continuous application of either AMP or ADP. pCTR indicates that cells were primed with ATP for 10 sec and then washed for the rest of the experiment with control (CTR) solution. *p < 0.05.
Fig. 8.
Fig. 8.
Nucleotide-induced IL-1β release from LPS-stimulated microglial cells. Released IL-1β (mean ± SEM) from N9 mouse microglial cells (A, 2 mm ATP, 5 mm ADP, and 10 mm AMP), primary cultured mouse microglia (B, 2 mm ATP, 10 mm ADP, and 10 mm AMP), and primary cultured human microglia (C, 1 mm ATP, 10 mm ADP, and 10 mm AMP) in response to stimulation with ATP and in response to ADP or AMP with and without previous priming with ATP is shown. pAMP andpADP indicate that cells were primed with ATP for 2 min and then washed twice for 1 min before application of the nucleotide (in LPS-containing medium) for 15 min. pCTR indicates that cells were primed with ATP for 2 min followed by two washes, and then the supernatant was taken at 15 min. ADP+Hexo orAMP+Hexo indicates that cells were stimulated with LPS for 2 hr in the presence of hexokinase and glucose (as a substrate) before washout and addition of the indicated nucleotide for 15 min. *p < 0.05. Open bars indicate CTR or ATP challenge, solid bars indicate ADP challenge, andgray bars indicate AMP challenge.

References

    1. Aloisi F, De Simone R, Columba-Cabezas S, Levi G. Opposite effects of interferon-γ and prostaglandin E2 on tumor necrosis factor and interleukin-10 production in microglia: a regulatory loop controlling microglia pro- and anti-inflammatory activities. J Neurosci Res. 1999;56:571–580. - PubMed
    1. Baricordi OR, Melchiorri L, Adinolfi E, Falzoni S, Chiozzi P, Buell G, Di Virgilio F. Increased proliferation rate of lymphoid cells transfected with the P2X(7) ATP receptor. J Biol Chem. 1999;274:33206–33208. - PubMed
    1. Boué-Grabot E, Archambault V, Séguéla P. A protein kinase C site highly conserved in P2X subunits controls the desensitization kinetics of P2X(2) ATP-gated channels. J Biol Chem. 2000;275:10190–10195. - PubMed
    1. Buell G, Chessell IP, Michel AD, Collo G, Salazzo M, Herren S, Gretener D, Grahames C, Kaur R, Kosco-Vilbois MH, Humphrey PP. Blockade of human P2X7 receptor function with a monoclonal antibody. Blood. 1998;92:3521–3528. - PubMed
    1. Buttini M, Sauter A, Boddeke HWGM. Induction of interleukin-1 beta messenger RNA after focal cerebral ischaemia in the rat. Mol Brain Res. 1994;23:126–134. - PubMed

Publication types

MeSH terms

LinkOut - more resources