. 2002 Apr 15;22(8):3189-205.
doi: 10.1523/JNEUROSCI.22-08-03189.2002.

The timing of response onset and offset in macaque visual neurons

Affiliations

The timing of response onset and offset in macaque visual neurons

Wyeth Bair et al. J Neurosci. .

Abstract

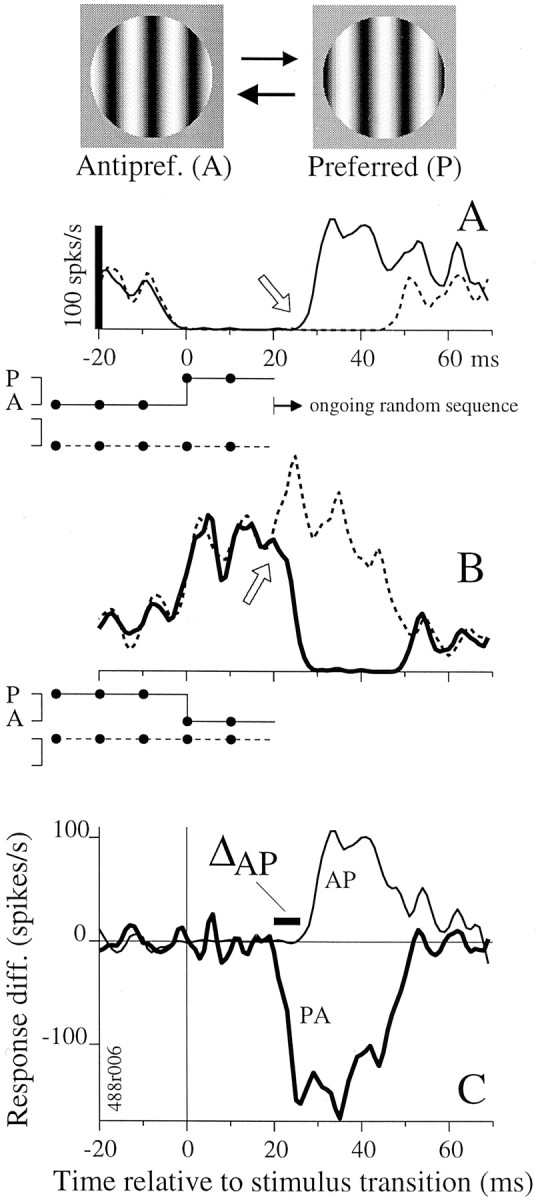
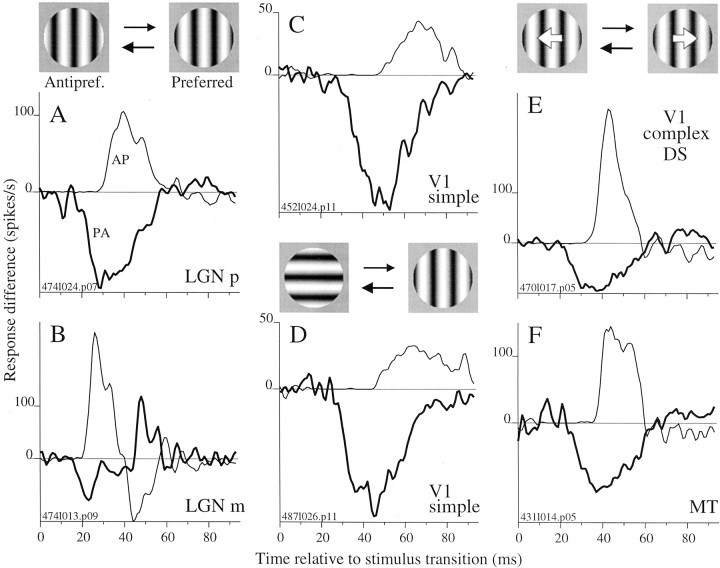
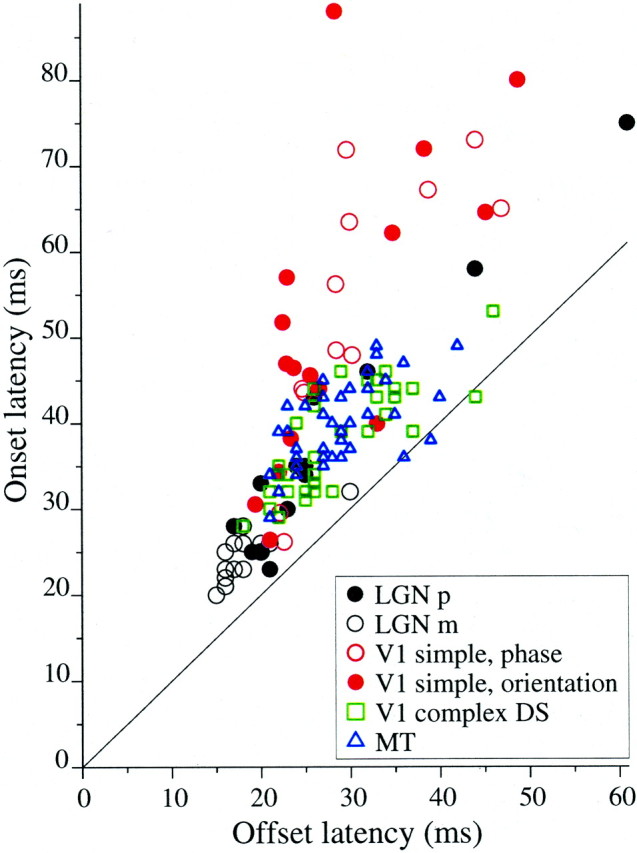
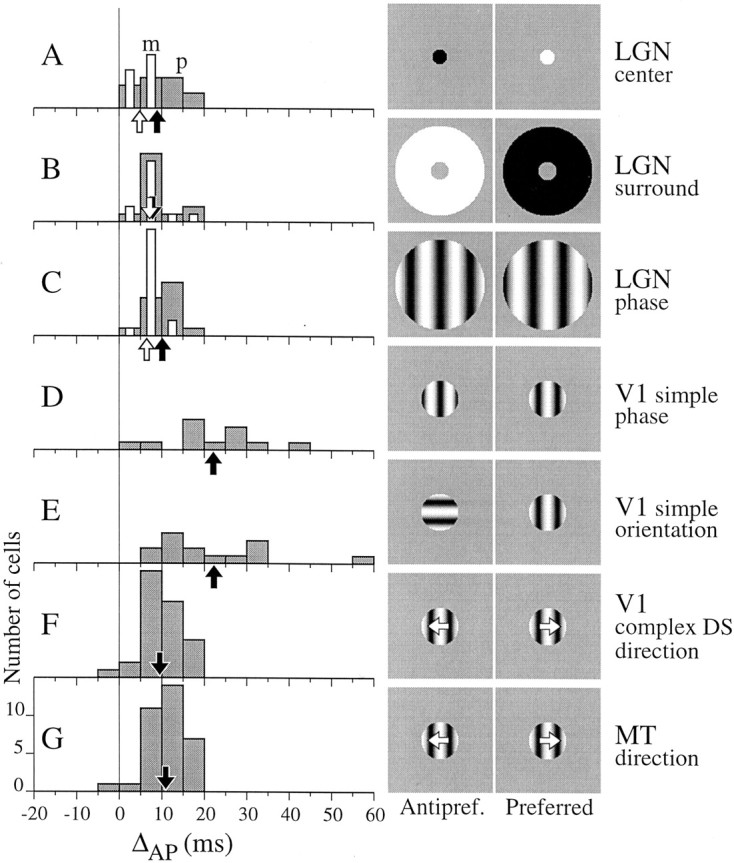
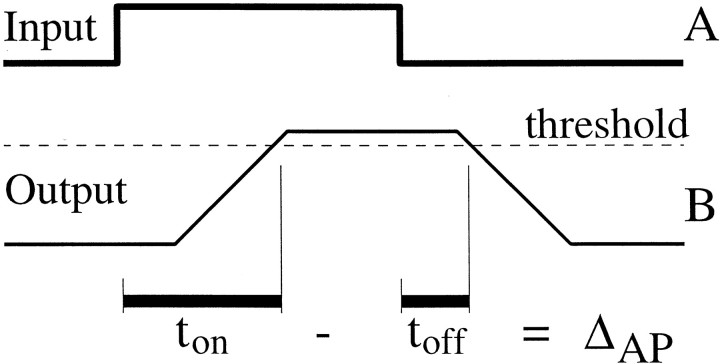
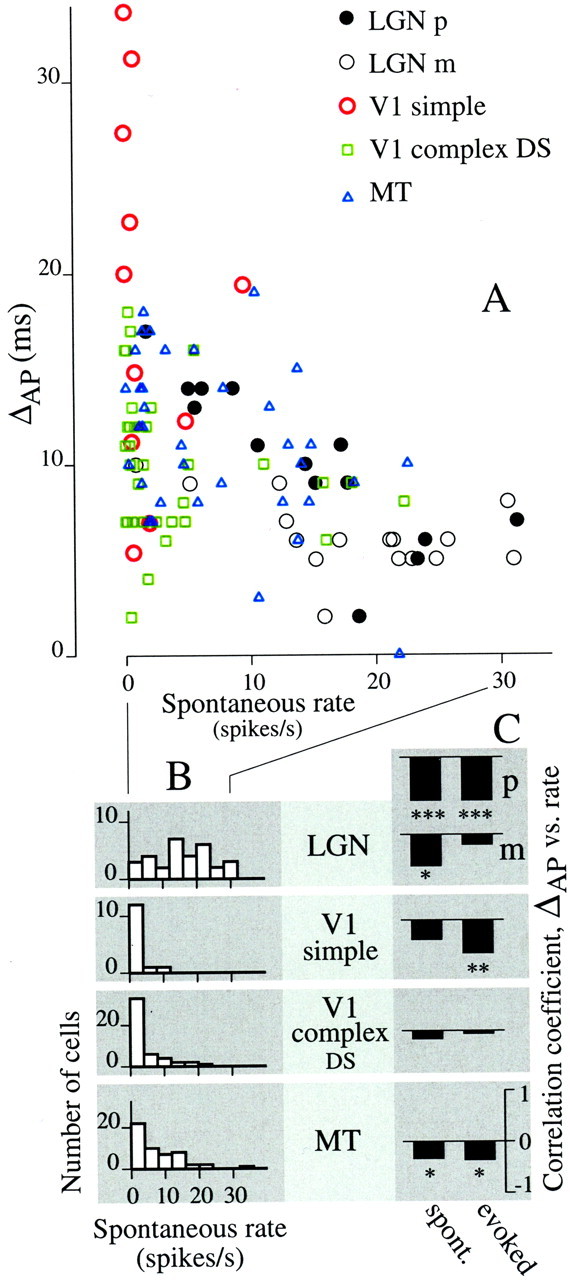
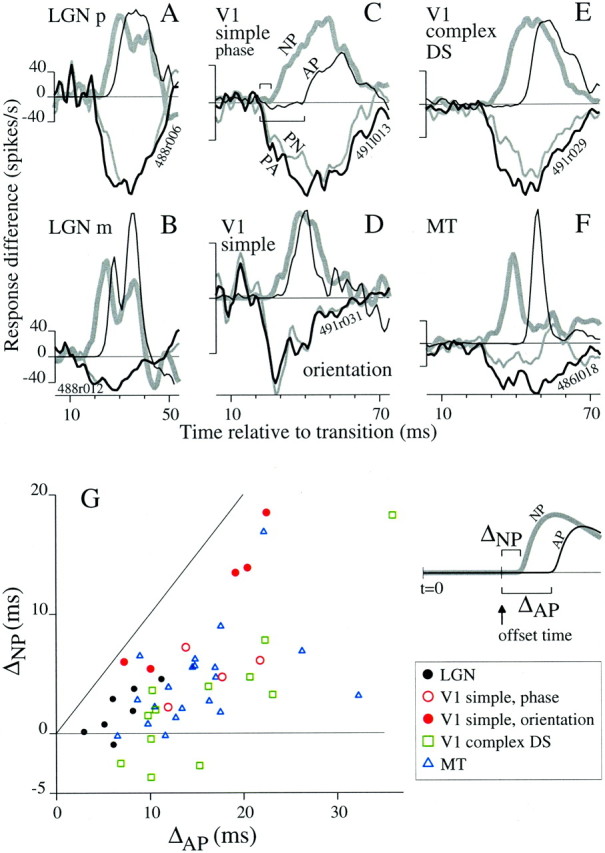
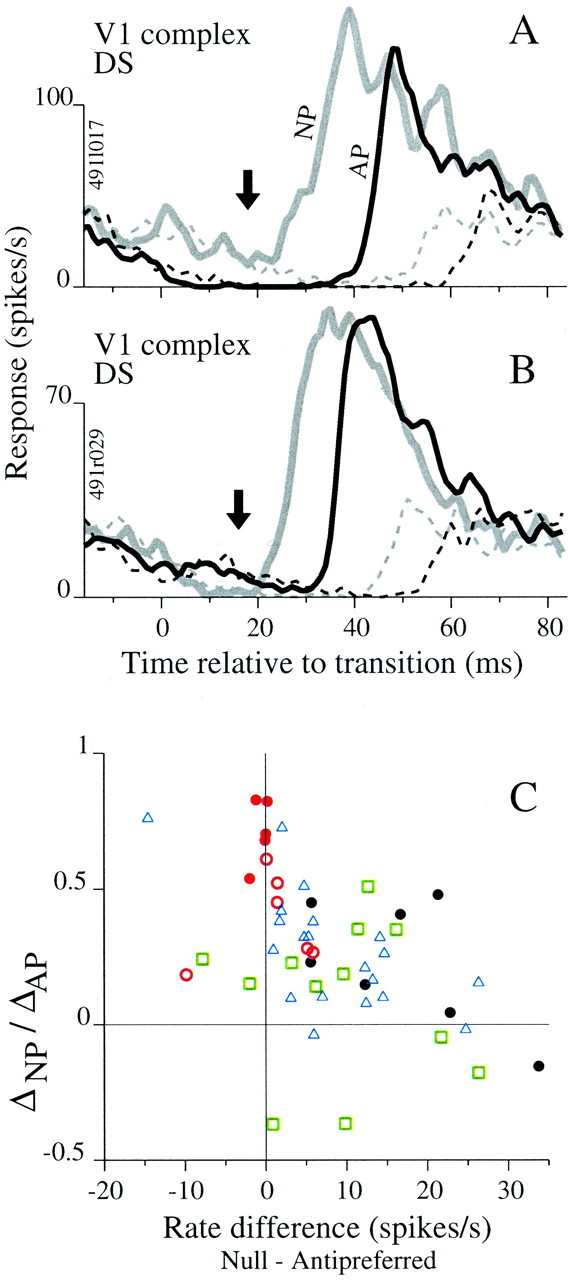
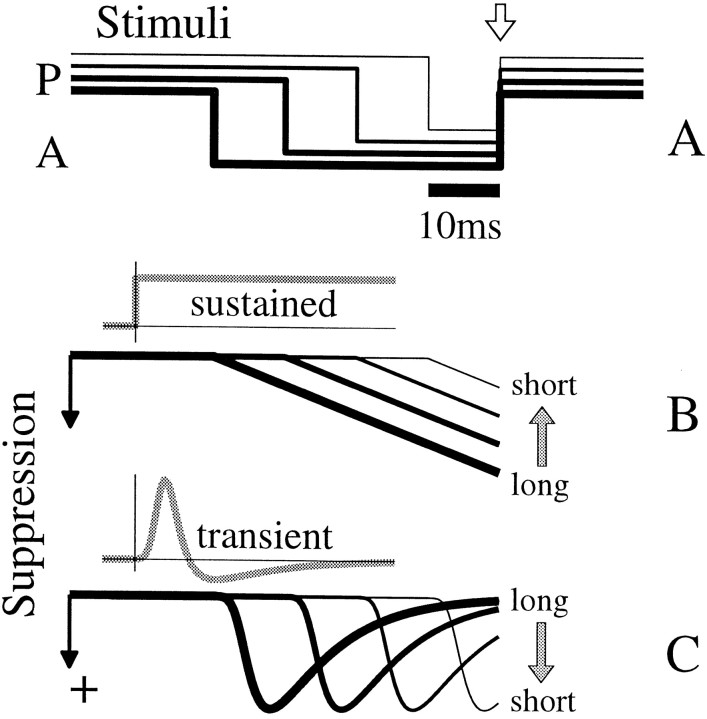
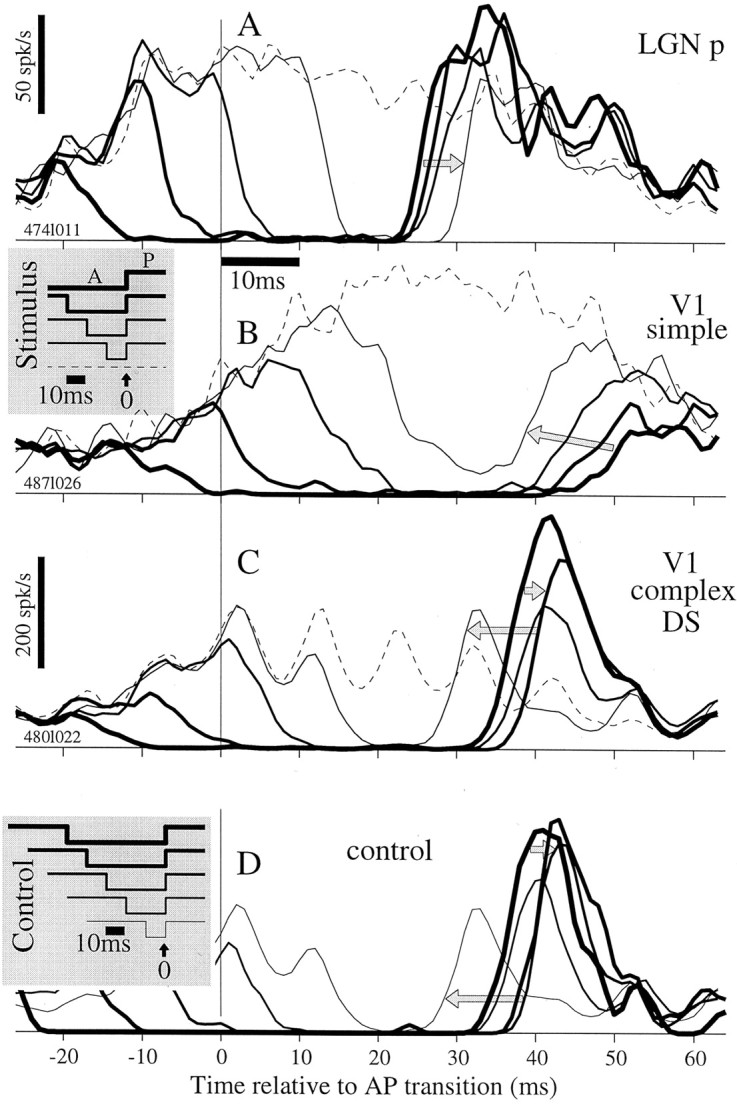
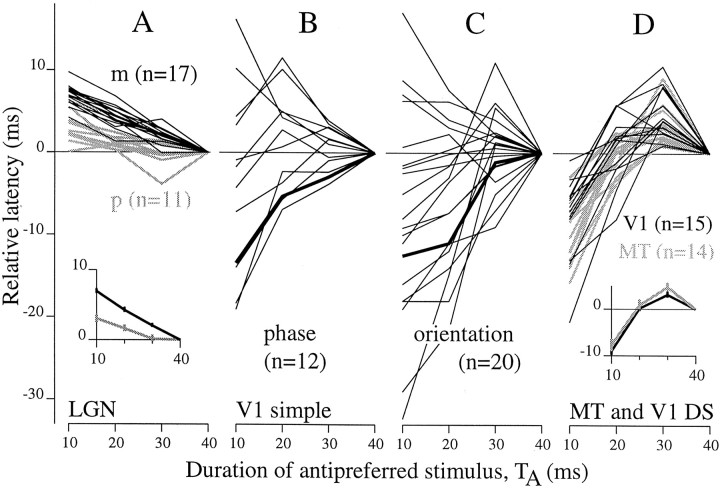
We used fast, pseudorandom temporal sequences of preferred and antipreferred stimuli to drive neuronal firing rates rapidly between minimal and maximal across the visual system. Stimuli were tailored to the preferences of cells recorded in the lateral geniculate nucleus (magnocellular and parvocellular), primary visual cortex (simple and complex), and the extrastriate motion area MT. We found that cells took longer to turn on (to increase their firing rate) than to turn off (to reduce their rate). The latency difference (onset minus offset) varied from several to tens of milliseconds across cell type and stimulus class and was correlated with spontaneous or driven firing rates for most cell classes. The delay for response onset depended on the nature of the stimulus present before the preferred stimulus appeared, and may result from persistent inhibition caused by antipreferred stimuli or from suppression that followed the offset of the preferred stimulus. The onset delay showed three distinct types of dependence on the temporal sequence of stimuli across classes of cells, implying that suppression may accumulate or wear off with time. Onset latency is generally longer, can be more variable, and has marked stimulus dependence compared with offset latency. This suggests an important role for offset latency in assessing the speed of information transmission in the visual system and raises the possibility that signal offsets provide a timing reference for visual processing. We discuss the origin of the delay in onset latency compared with offset latency and consider how it may limit the utility of certain feedforward circuits.


Figures

Fig. 1.
Fig. 1.
The estimation and comparison of response timing for turning on and turning off are demonstrated for an LGN p-cell.Top, Stimulus icons show preferred and antipreferred stimuli, P and A, one of which was chosen randomly for presentation every 10 msec. A, Average firing rate versus time is plotted for two 50 msec stimulus sequences, which are depicted below the abscissa. Solid lines indicate the stimulus and response for a transition from A to P (i.e., a change from the left to right stimulus icon, top), whereas dashed lines indicate the reference stimulus, 50 msec of A, and its response. Time 0 is when the transition to P occurred. Response latency was ∼30 msec; therefore, the first and last 20 msec of the response traces are averages of responses to a random set of sequences that occurred before and after the 50 msec trigger sequences (seearrow and label ongoing random sequence) and should not be confused with spontaneous firing rate. Epochs of A were associated with near zero firing rate, and the onset of P caused a rapid rate increase (solid response curve). Response curves were based on 253 occurrences of the stimulus sequences (see Materials and Methods). B, Responses of the same cell to the PA transition (a change from the right to left stimulus icon,top) are shown in the format of A. Firing rate was high for P epochs and dropped rapidly after the transition to A. Response curves were based on 253 occurrences of the stimulus sequences. C, The difference between the response to the AP transition and to its reference stimulus (in A, solid minus dotted line) is plotted here as the thin line. The analogous difference between the traces in B is plotted as the thick line. These response difference traces allow direct comparison of the timing of the onset of signals evoked by the AP and PA stimulus transitions. We defined ΔAP to be the difference in timing between the onsets of the AP and PA response (thick bar; see Materials and Methods).
Fig. 2.
Fig. 2.
Response decreases occurred sooner than response increases when switching between P and A. For five classes of neurons, response difference plots (defined in Fig. 1) for PA and AP transitions (thick and thin lines, respectively) are shown for example cells responding to binary random sequences of optimized sinusoidal grating stimuli. A, Difference plots for an LGN p-cell responding to the phase stimulus (transitions between opposite phases, icons, top ofleft column) show that the PA response occurred before the AP response. B, For an LGN m-cell responding to the phase stimulus, a smaller timing asymmetry is present. The sign reversal at ∼40 msec resulted from the combination of the transient nature of the m-cell response and the chance transitions that followed the reference stimuli (e.g., 50 msec of A was sometimes followed by P and vice versa). C, Difference plots for a V1 simple cell responding to the phase stimulus show a timing asymmetry larger than that observed for the LGN cells in A andB. D, Responses of a V1 cell to transitions between orthogonal orientations (icons incenter) also show a large timing asymmetry. Responses of a V1 complex DS cell (E) and an MT cell (F) to transitions between opposite directions of motion (icons, top of right column) show a timing asymmetry as well.
Fig. 3.
Fig. 3.
A comparison of onset and offset latencies across cell types and stimulus categories. The latency of the response to the transition from antipreferred to preferred (onset latency) is plotted against the latency of the response to the opposite stimulus transition (preferred to antipreferred, offset latency). Nearly all points fell above the diagonal line of equality, indicating that onset latency is longer than offset latency. The mean onset and offset latencies for each cell class and stimulus type are reported in Table 1.
Fig. 4.
Fig. 4.
The distribution of the timing asymmetry, ΔAP, across cell types and stimulus categories.A, LGN p-cells (gray bars,n = 13) and m-cells (white bars,n = 12) had ΔAP > 0 when driven by a disk in the RF center. The mean for p-cells, 8.9 msec (black arrow), was significantly greater than that for m-cells, 4.8 msec (white arrow; t test,p = 0.017). B, When tested with an annulus in the RF surround, p- and m-cells had similar values of ΔAP (means, 7.8 and 7.2 msec, respectively).Arrows showing means overlap. C, For the phase stimulus, p-cells (n = 14) had a significantly larger ΔAP than m-cells (n = 17; means, 10.1 and 6.5 msec; ttest, p = 0.007). Black andwhite arrows show means for p- and m-cells, respectively. D, V1 simple cells tested with the phase stimulus had more varied and larger ΔAP values on average (mean, 22 msec; n = 12) than ΔAP for the LGN. E, The distribution of ΔAP for V1 cells tested with the orientation stimulus was similar (mean, 22 msec;n = 14) to that for the phase stimulus.F, V1 complex DS cells (n = 32) tested with the direction stimulus had on average a smaller (9.5 msec) and less scattered value of ΔAP than simple cells tested with static gratings. G, MT cells (n= 34) tested with the direction stimulus had a distribution of ΔAP similar to that for V1 complex DS cells (mean, 10.9 msec).
Fig. 5.
Fig. 5.
A system with a high threshold takes longer to turn on than to turn off. If the input in A, plotted as a function of time, is delayed and smoothed by convolution with a boxcar function, the trace in B results. The delay from the rise in the input to the rise in the output is equal to that from the fall in the input to the fall in the output. However, if the system responds only when the output is above a high threshold (dashed line), the latency to response onset (ton) is longer than the latency to offset (toff) by an amount approximately equal to the time to rise to threshold. Thus, ΔAP approximates the integration time of the system in this simple demonstration.
Fig. 6.
Fig. 6.
Firing rate is negatively correlated with ΔAP. A, For five classes of neurons, ΔAP is plotted as a function of spontaneous rate. LGN p- and m-cells and V1 simple cells were tested with the phase stimulus. V1 complex DS and MT cells were tested with the direction stimulus.B, The distribution of spontaneous rate varies across cell class. LGN p- and m-cell data were combined into one histogram because their distributions were statistically indistinguishable (t test for mean, p = 0.34;F test for variance, p = 0.89). LGN cells had high and varied spontaneous rates compared with cortical cells. C, Correlation coefficients computed between ΔAP and spontaneous rate (left column ofbars) and between ΔAP and evoked rate (right column) were always negative.Asterisks indicate statistical significance: *p < 0.05; **p < 0.01; ***p < 0.001. Evoked firing rate was computed in the 20 msec period after the onset of response to the AP transition.
Fig. 7.
Fig. 7.
The response to a preferred stimulus is delayed more when it follows an antipreferred stimulus than when it follows a null stimulus. A–F, For six example cells, black lines show response difference traces for PA and AP transitions (medium and thin lines, respectively), and gray lines show response differences for PN and NP transitions (medium and thick lines, respectively). Cell types (top left corners) and stimulus categories match those in Figure 2. The phase stimulus applies to A–C, the orientation stimulus to D, and the direction stimulus to E andF. Bars in C indicate the latency of the NP (gray bar) and AP (open bar) responses relative to the PA latency. G, For all cells tested with ternary stimuli, ΔNP is plotted against ΔAP. For all cells, ΔNP < ΔAP. When ΔAP was low, ΔNPwas on average near zero. m-Cells and p-cells were grouped together (filled black circles) because there was no significant difference between their measurements plotted here (5 p-cells, 2 m-cells).
Fig. 8.
Fig. 8.
Comparing firing rates for antipreferred and null stimuli. A, Average responses for AP (black line) and NP (gray line) transitions and for reference stimuli (dashed lines of corresponding color; see Fig. 1A for stimulus timing). Before the response to the preferred stimulus, the rate associated with N (gray lines belowarrow) is higher than that associated with A (black lines below arrow). This trend held for 31 of 34 cells tested with the ternary, direction stimulus. Responses include at least 225 occurrences of each pattern.B, Format like A, but for one of three DS cells that had a higher firing rate before the AP response transition (black lines) than before the NP transition (gray lines). Responses include at least 450 occurrences of each pattern. C, The ratio ΔNPAP is plotted against the difference between null and antipreferred firing rates (calculated in the 10 msec epoch before the response to the transition) for LGN (filled circles), V1 simple cells (red circles) tested with phase (filled) and orientation (open) stimuli, V1 complex DS cells (green squares), and MT cells (blue triangles). There was a significant correlation across the combined data sets (r = −0.49;p = 0.0003; n = 50) and for the MT cells alone (r = −66; p = 0.001; n = 20). None of the V1 data sets had significant correlations by themselves. For the LGN,r = −0.60 (p = 0.15;n = 7).
Fig. 9.
Fig. 9.
Two conceptual models of suppression activated during an antipreferred pulse make opposite predictions.A, Four stimulus sequences with various duration A pulses are aligned to the AP transition (open arrow).Thicker traces show stimuli with longer A pulses. Stimulus traces are offset vertically for clarity here, but traces inB and C have no vertical offset.B, The time course of suppression that resulted from a sustained integration of the A pulses is plotted withlines of the same thickness used for the stimuli in A. The stimuli were convolved with thegray step function, which models suppression that accumulates over time. The suppression was larger for longer A pulses (downward indicates stronger suppression). C, When the stimuli were convolved with a fast, transient function (gray line), suppression for longer A pulses had decayed more than that for shorter pulses at the time of the AP transition (right ends of lines). This trend is opposite to that in B.
Fig. 10.
Fig. 10.
Latency depends on the duration of the antipreferred stimulus, and the dependency shows several trends across cell classes. A, LGN p-cell average responses for five stimulus sequences (see stimulus inset belowA) for counterphase stimulus. The response delay increased (gray arrow) as the antipreferred epoch was shortened. This trend occurred for all p- and m-cells. Responses include at least 250 occurrences for each pattern. B, Responses for this V1 simple cell to the counterphase stimulus showed a trend opposite to that for LGN: the response delay decreased (gray arrow) as the antipreferred epoch was shortened. This was representative of more than half of V1 cells, whereas others showed a trend similar to that in the LGN. Responses include at least 250 occurrences for each pattern. C, Responses for a V1 complex DS cell to the direction stimulus show a third trend: response latency first increased (shorter arrow) and then decreased as the antipreferred epoch was shortened (longer arrow). Responses include at least 188 occurrences for each pattern. This was typical of V1 complex DS cells and MT cells. D, Responses are shown for six stimuli (gray inset), which each have 30 msec of P before the A epoch. The fifth stimulus (thinnest line) is unchanged from the top panels. As TAshortens, the response to the AP transition first shifts rightward and then leftward, consistent with the behavior in C. Responses include 12, 24, 48, 94, and 192 occurrences for thethickest to thinnest lines, respectively.
Fig. 11.
Fig. 11.
Summary of duration dependence of latency across cell classes. Relative latencies for 5% rise-to-peak are plotted against the duration of the antipreferred stimulus, TA, that preceded the AP transition. All values are given relative to the value for TA = 40 msec.A, Each line emanating from the point (40,0) shows data for a p-cell (gray lines) or an m-cell (black lines). For nearly all LGN cells, latency increased as TA decreased. The average relative latencies are plotted for p-cells (gray line) and m-cells (black line) in the inset (error bars show ±1 SEM). m-cells on average had significantly longer relative latencies (t test; p < 0.00001; 7.0 > 3.7 msec; TA = 10 msec). Results shown here are for counterphase stimuli. Cell counts appear inparentheses. B, Similar data are plotted for V1 simple cells tested with counterphase stimuli. These plots show that V1 had more diverse behavior than the LGN. Latency could increase or decrease as TA decreased. The thick linecorresponds to the example data in Figure 10B for which the latency decreased with TA. C, Similar to B, but for V1 simple cells tested with the orthogonal orientation stimulus. The thick linehere and in B show data collected from the same cell.D, For V1 complex cells (black lines) and MT cells (gray lines) tested with the direction stimulus, response latency first increased and then decreased as TA was reduced from 40 to 10 msec. The insetshows the average relative latency for MT cells and V1 complex DS cells.

References

    1. Adelson EH, Bergen JR. Spatiotemporal energy models for the perception of motion. J Opt Soc Am A. 1985;2:284–299. - PubMed
    1. Adrian ED, Matthews R. The action of light on the eye. Part I. The discharge of impulses in the optic never and its relation to the electric changes in the retina. J Physiol (Lond) 1927;63:378–414. - PMC - PubMed
    1. Agmon A, Connors BW. Correlation between intrinsic firing patterns and thalamocortical synaptic responses of neurons in mouse barrel cortex. J Neurosci. 1992;12:319–329. - PMC - PubMed
    1. Ahissar E, Sosnik R, Haidarliu S. Transformation from temporal to rate coding in a somatosensory thalamocortical pathway. Nature. 2000;406:302–306. - PubMed
    1. Albright TD, Desimone R, Gross CG. Columnar organization of directionally selective cells in visual area MT of the macaque. J Neurophysiol. 1984;51:16–31. - PubMed

Publication types