

Diffusion tensor MR imaging of high-grade cerebral gliomas
- PMID: 11950638
- PMCID: PMC7975109
Diffusion tensor MR imaging of high-grade cerebral gliomas
Abstract
Background and purpose: Optimizing high-grade glioma treatment requires the delineation of edematous and normal brain from tumor, perhaps by using potential differences in the absolute diffusion parameters of water. Our purpose was to determine whether mean diffusivity <D> and diffusion anisotropic MR imaging data help in this differentiation.
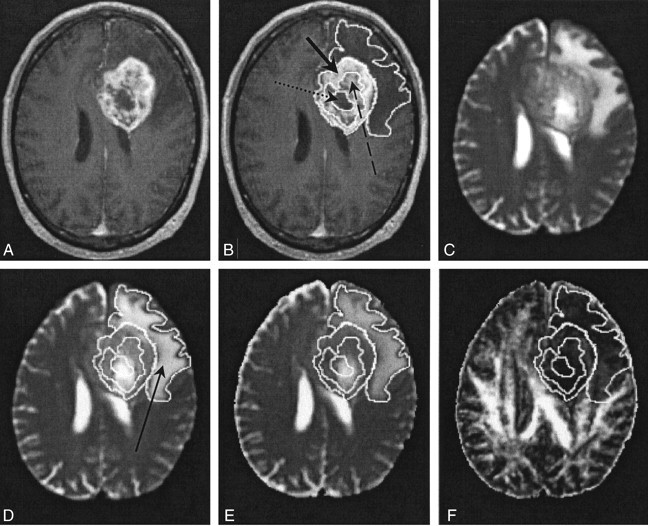
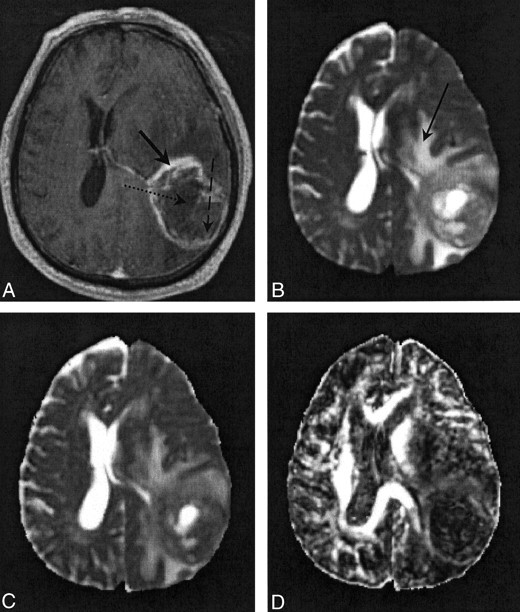
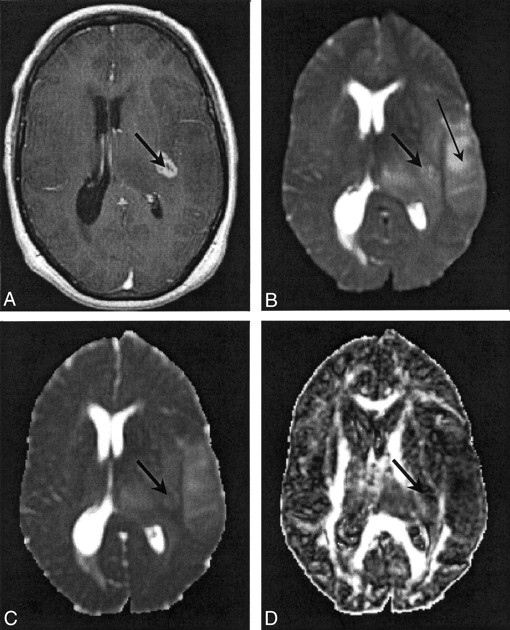
Methods: Nine patients with high-grade cerebral glioblastoma underwent contrast-enhanced structural and diffusion tensor MR imaging before therapy. Tumor, edematous brain, and apparently normal white matter regions were determined on T2-weighted and contrast-enhanced T1-weighted structural images. Fractional anisotropy (FA) and <D> were measured in each tissue type. Differences in these values among the tissue types were assessed with a standard analysis of variance.
Results: <D> was highest in the necrotic tumor core (1825.38 +/-404.06) x 10(-6) mm(2)/s, followed by edematous brain (1411.23 +/- 322.31) x 10(-6) mm(2)/s, enhancing tumor core (1308.67 +/- 292.50) x 10(-6) mm(2)/s, enhancing tumor margin (1229.80 +/- 206.80) x 10(-6) mm(2)/s, and normal brain (731.53 +/- 35.21) x 10(-6) mm(2)/s. FA was highest in normal brain (0.47 +/- 0.08) and lowest in the necrotic core (0.09 +/- 0.03). <D> was significantly different in enhancing tumor margins and edematous brain in all patients; FA was significantly different in only seven. These values were significantly different from those of normal brain in all cases in which they were measurable.
Conclusion: <D> values can be used to differentiate normal white matter, edematous brain, and enhancing tumor margins. Diffusion anisotropic data added no benefit to tissue differentiation. Further studies are required to determine if a <D> value that corresponds to the limit of tumor invasion can be identified.
Figures
References
-
- Legler JM, Ries LA, Smith MA, et al. Cancer surveillance series corrected: brain and other central nervous system cancers: recent trends in incidence and mortality. J Natl Cancer Inst 1999;91:1382–1390 - PubMed
-
- Tovi M. MR imaging in cerebral gliomas analysis of tumour tissue components. Acta Radiol Suppl 1993;384:1–24 - PubMed
-
- Basser PJ, Mattiello J, LeBihan D. Estimation of the effective self-diffusion tensor from the NMR spin echo. J Magn Reson B 1994;103:247–254 - PubMed
-
- Pierpaoli C, Basser PJ. Toward a quantitative assessment of diffusion anisotropy. Magn Reson Med 1996;36:893–906 - PubMed
-
- Basser PJ, Pajevic S, Pierpaoli C, Duda J, Aldroubi A. In vivo fiber tractography using DT-MRI data. Magn Reson Med 2000;44:625–632 - PubMed
Publication types
MeSH terms
LinkOut - more resources
Full Text Sources
Medical