

Quantitative trait loci on chromosomes 1, 2, 3, 4, 8, 9, 11, 12, and 18 control variation in levels of T and B lymphocyte subpopulations
- PMID: 11951176
- PMCID: PMC447593
- DOI: 10.1086/340090
Quantitative trait loci on chromosomes 1, 2, 3, 4, 8, 9, 11, 12, and 18 control variation in levels of T and B lymphocyte subpopulations
Erratum in
- Am J Hum Genet 2002 Sep;71(3):693
Abstract
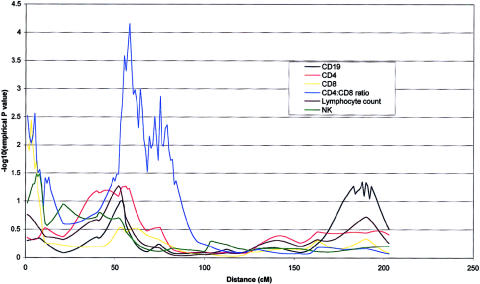
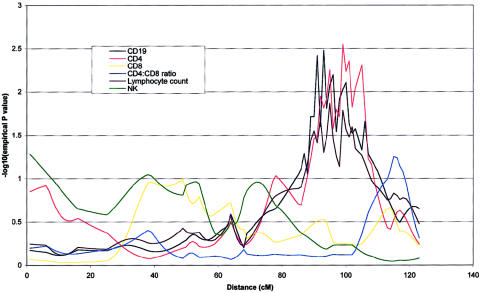
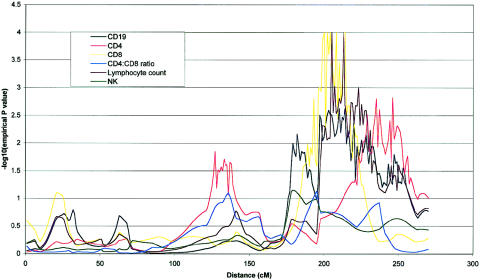
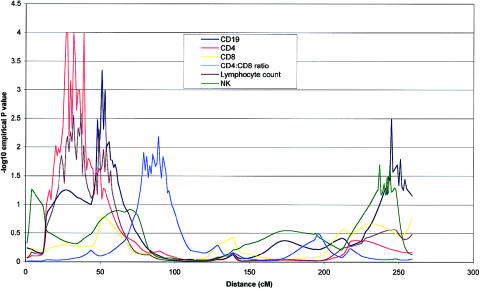
Lymphocyte subpopulation levels are used for prognosis and monitoring of a variety of human diseases, especially those with an infectious etiology. As a primary step to defining the major gene variation underlying these phenotypes, we conducted the first whole-genome screen for quantitative variation in lymphocyte count, CD4 T cell, CD8 T cell, B cell, and natural killer cell numbers, as well as CD4:CD8 ratio. The screen was performed in 15 of the CEPH families that form the main human genome genetic project mapping resource. Quantitative-trait loci (QTLs) that account for significant proportions of the phenotypic variance of lymphocyte subpopulations were detected on chromosomes 1, 2, 3, 4, 8, 9, 11, 12, and 18. The most significant QTL found was for CD4 levels on chromosome 8 (empirical P=.00005). Two regions of chromosome 4 showed significant linkage to CD4:CD8 ratio (empirical P=.00007 and P=.003). A QTL for the highly correlated measures of CD4 and CD19 levels colocalized at 18q21 (both P=.003). Similarly, a shared region of chromosome 1 was linked to CD8 and CD19 levels (P=.0001 and P=.002, respectively). Several of the identified chromosome regions are likely to harbor polymorphic candidate genes responsible for these important human phenotypes. Their discovery has important implications for understanding the generation of the immune repertoire and understanding immune-system homeostasis. More generally, these data show the power of an integrated human gene-mapping approach for heritable molecular phenotypes, using large pedigrees that have been extensively genotyped.
Figures
References
Electronic-Database Information
-
- CEPH Genotype Database, http://www.cephb.fr/cephdb/
-
- Center for Medical Genetics, Marshfield Medical Research Foundation http://research.marshfieldclinic.org/genetics/
-
- Online Mendelian Inheritance in Man (OMIM), http://www.ncbi.nlm.nih.gov/Omim/ (for CD4 antigen [MIM 186940], CD8 antigen [MIM 186910], CD19 antigen [MIM 107265], and CD4/CD8 T cell ratio [MIM 601083])
-
- SAGE documentation, http://darwin.cwru.edu/sage40/sage40.html
References
-
- Ahmadi KR, Hall MA, Norman P, Vaughan RW, Snieder H, Spector TD, Lanchbury JS (2001) Genetic determinism in the relationship between human CD4 + and CD8+ T lymphocyte populations? Genes Immun 2:381–387 - PubMed
-
- Amadori A, Zamarchi R, Chieco-Bianchi L (1996) CD4: CD8 ratio and HIV infection: the “tap-and-drain” hypothesis. Immunol Today 17:414–417 - PubMed
-
- Amadori A, Zamarchi R, De Silvestro G, Forza G, Cavatton G, Danieli GA, Clementi M, Chieco-Bianchi L (1995) Genetic control of the CD4/CD8 T-cell ratio in humans. Nat Med 1:1279–1283 - PubMed
-
- Anderson DM, Maraskovsky E, Billingsley WL, Dougall WC, Tometsko ME, Roux ER, Teepe MC, DuBose RF, Cosman D, Galibert L (1997) A homologue of the TNF receptor and its ligand enhance T-cell growth and dendritic-cell function. Nature 390:175–179 - PubMed
Publication types
MeSH terms
Substances
Associated data
- Actions
- Actions
- Actions
Grants and funding
LinkOut - more resources
Full Text Sources
Other Literature Sources
Research Materials
