

Apoptosis is associated with triacylglycerol accumulation in Jurkat T-cells
- PMID: 11953830
- PMCID: PMC2364152
- DOI: 10.1038/sj.bjc.6600188
Apoptosis is associated with triacylglycerol accumulation in Jurkat T-cells
Abstract
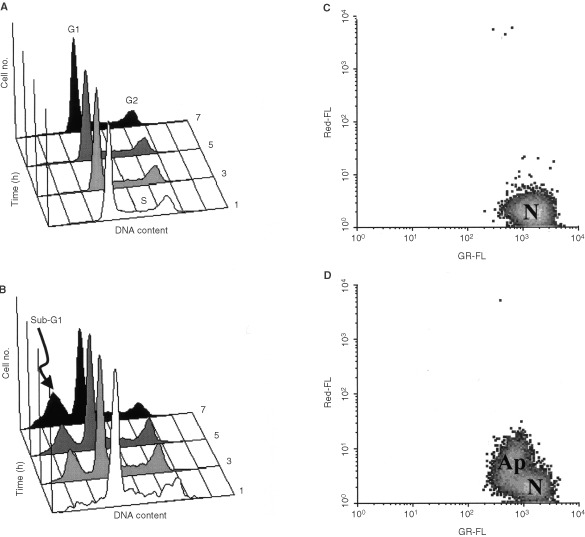
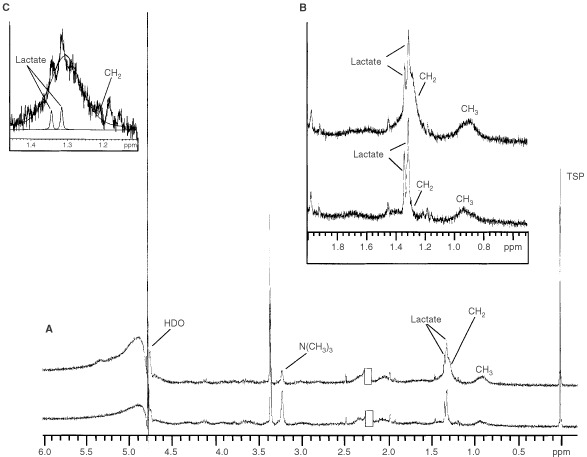
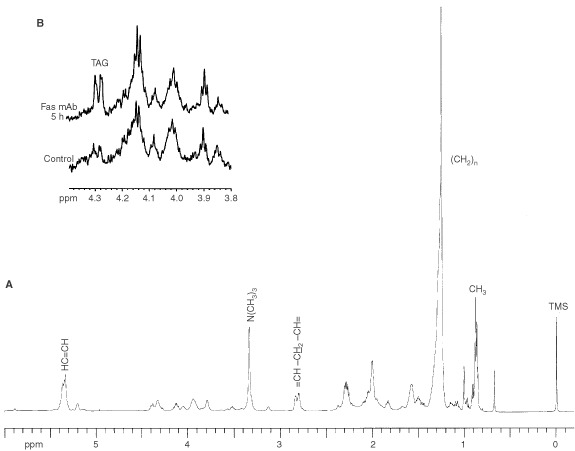
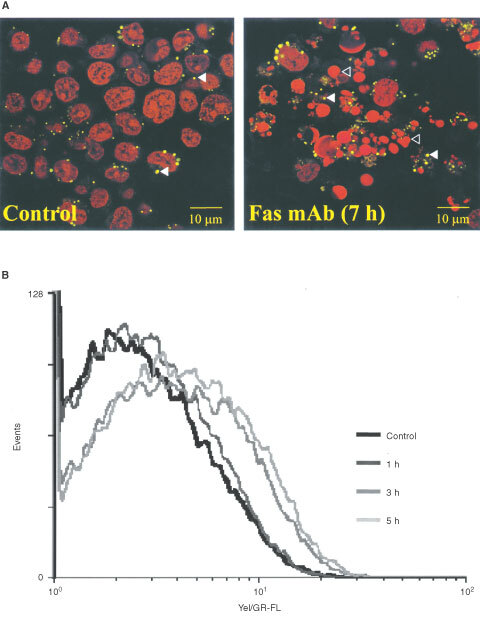
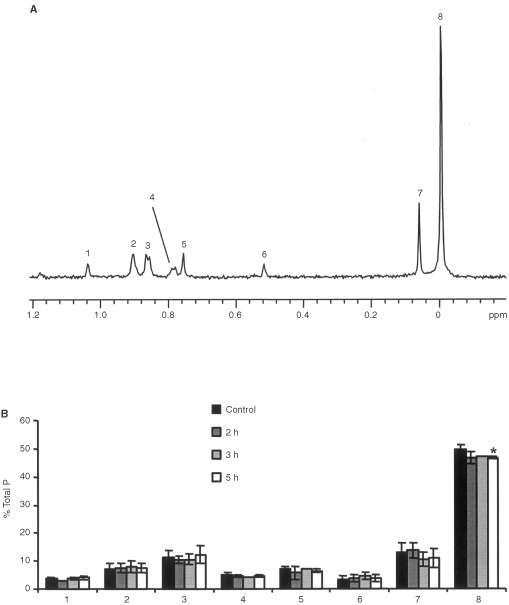
Magnetic resonance spectroscopy is increasingly used as a non-invasive method to investigate apoptosis. Apoptosis was induced in Jurkat T-cells by Fas mAb. (1)H magnetic resonance spectra of live cells showed an increase in methylene signal as well as methylene/methyl ratio of fatty acid side chains at 5 and 24 h following induction of apoptosis. To explain this observation, (1)H magnetic resonance spectra of cell extracts were investigated. These demonstrated a 70.0+/-7.0%, 114.0+/-8.0% and 90.0+/-5.0% increase in the concentration of triacylglycerols following 3, 5 and 7 h of Fas mAb treatment (P<0.05). Confocal microscopy images of cells stained with the lipophilic dye Nile Red demonstrated the presence of lipid droplets in the cell cytoplasm. Quantification of the stained lipids by flow cytometry showed a good correlation with the magnetic resonance results (P > or =0.05 at 3, 5 and 7 h). (31)P magnetic resonance spectra showed a drop in phosphatidylcholine content of apoptosing cells, indicating that alteration in phosphatidylcholine metabolism could be the source of triacylglycerol accumulation during apoptosis. In summary, apoptosis is associated with an early accumulation of mobile triacylglycerols mostly in the form of cytoplasmic lipid droplets. This is reflected in an increase in the methylene/methyl ratio which could be detected by magnetic resonance spectroscopy.
Copyright 2002 Cancer Research UK
Figures
References
-
- Al-SaffarNMClarkePADiStefanoFLeachMORonenSM1999Detection of metabolic changes associated with Fas- and chemotherapy-induced apoptosis using MRS Proc ISMRM(Abstract)
-
- AnthonyMLZhaoMBrindleKM1999Inhibition of phosphatidylcholine biosynthesis following induction of apoptosis in HL-60 cells J Biol Chem 2741968619692 - PubMed
-
- AtsumiG-ITajimaMHadanoANakataniYMurakamiMKudoI1998Fas-induced arachidonic acid release is mediated by Ca2+-independent phospholipase A2 but not cytosolic phospholipase A2, which undergoes proteolytic inactivation J Biol Chem 2731387013877 - PubMed
-
- BarbaICabañasMEArusC1999The relationship between nuclear magnetic resonance-visible lipids, lipid droplets, and cell proliferation in cultured C6 cells Cancer Res 5918611868 - PubMed
-
- BarbaIMannPCabañasMEArusCGasparovicC2001Mobile lipid production after confluence and pH stress in perfused C6 cells NMR in Biomedicine 143340 - PubMed
Publication types
MeSH terms
Substances
LinkOut - more resources
Full Text Sources
Research Materials
Miscellaneous
