

CT gel dosimetry technique: comparison of a planned and measured 3D stereotactic dose volume
- PMID: 11958651
- PMCID: PMC5724611
- DOI: 10.1120/jacmp.v3i2.2575
CT gel dosimetry technique: comparison of a planned and measured 3D stereotactic dose volume
Abstract
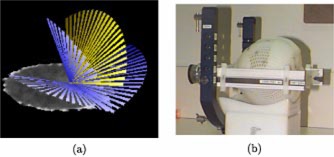
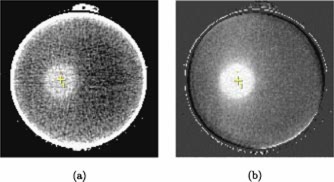
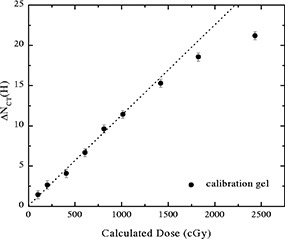
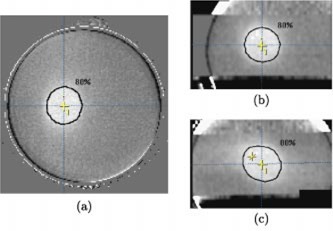
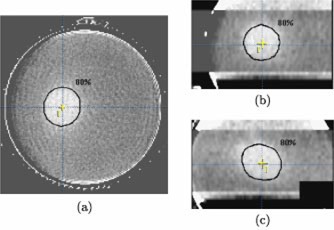
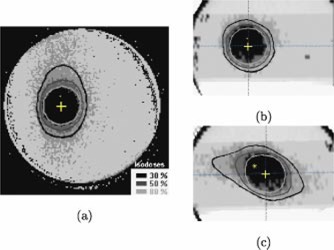
This study presents a 3D dose mapping of complex dose distributions using an x-ray computed tomography (CT) polymer gel dosimetry technique. Two polyacrylamide gels (PAGs) of identical composition were irradiated with the same four arc stereotactic treatment to maximum doses of 15 Gy (PAG1) and 8 Gy (PAG2). The PAGs were CT imaged using a previously defined protocol that involves image averaging and background subtraction to improve image quality. For comparison with the planned isodose distribution, the PAG images were converted to relative dose maps using a CT number-dose calibration curve or simple division. The PAG images were then co-registered with the planning CT images in the BrainLab treatment planning software which automatically provides reconstructed sagittal and coronal images for 3D evaluation of measured and planned dose. The hypo-intense high dose region in both sets of gel images agreed with the planned 80% isodose contour and was shifted by up to 1.5 and 3.0 mm in the axial and reconstructed planes, respectively. This demonstrates the ability of the CT gel technique to accurately localize the high dose region produced by the stereotactic treatment. The resulting agreement of the measured relative dose volume for PAG1 was within 3.0 mm for the 50% and 80% isodose surfaces. However, the dose contrast was too low in PAG2 to allow for accurate definition of measured relative dose surfaces. Thus, a PAG should be irradiated to higher doses if quantitative relative dose information is required. Unfortunately, this implies use of an additional PAG and its CT number dose response since doses greater than 8-10 Gy fall outside the linear regions of the response.
Figures
References
-
- Alexander P. and Fox M., “The degradation of polymethacrylic acid by x‐rays,” Trans. Faraday Soc. 50, 605–12 (1954).
-
- Feng P. Y., “Polymer degradation‐wide range dosimeter,” Nucleonics 16, 114 (1958).
-
- Maryanski M. J., Gore J. C., Kennan R. P., and Schulz R., “NMR relaxation enhancement in gels polymerized and cross‐linked by ionizing radiation: A new approach to 3‐D dosimetry by MRI,” Magn. Reson. Imaging 11, 253–8 (1993). - PubMed
-
- Pappas E., Maris T., Angelopoulos A., Paparigopoulou M., Sakelliou L., Sandilos P., Voyiatzi S., and Vlachos L., “A new polymer gel for magnetic resonance imaging (MRI) radiation dosimetry,” Phys. Med. Biol. 44, 2677–84 (1999). - PubMed
-
- Cosgrove V. P., Murphy P. S., McJury M., Adams E. J., Warrinton A., Leach M. O., and Webb S., “The reproducibility of polyacrylamide gel dosimetry applied to stereotactic conformal radiotherapy,” Phys. Med. Biol. 45, 1195–210 (2000). - PubMed
Publication types
MeSH terms
Substances
LinkOut - more resources
Full Text Sources
Medical
Research Materials
