. 2002 Apr;135(8):1943-50.
doi: 10.1038/sj.bjp.0704660.

Direct visualization of ligand-protein interactions using atomic force microscopy

Affiliations

Direct visualization of ligand-protein interactions using atomic force microscopy

Calum S Neish et al. Br J Pharmacol. 2002 Apr.

Abstract

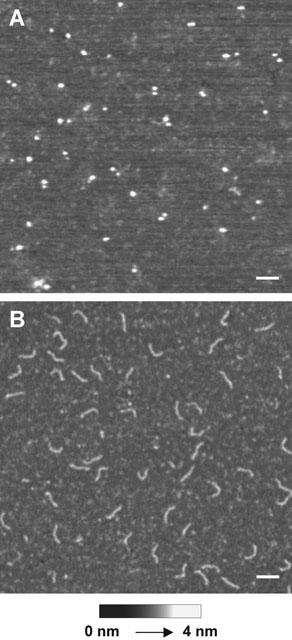
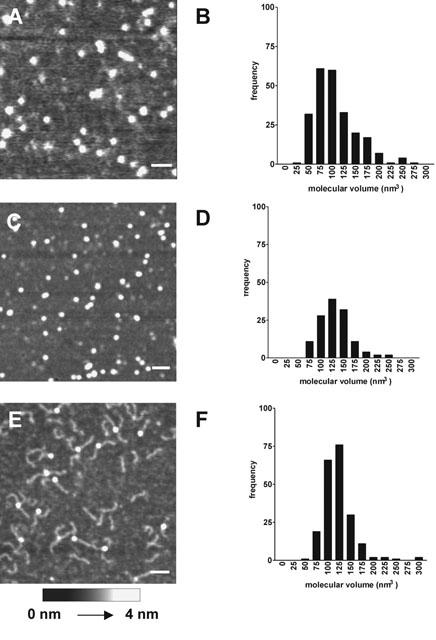
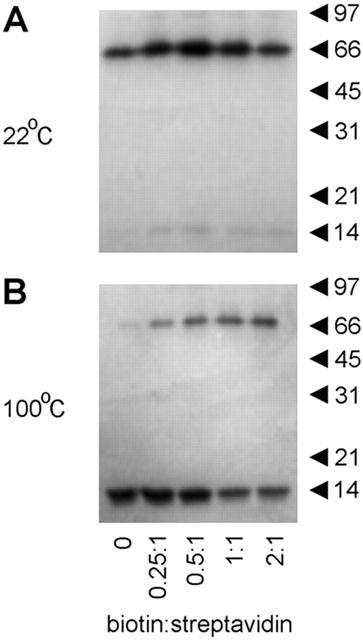
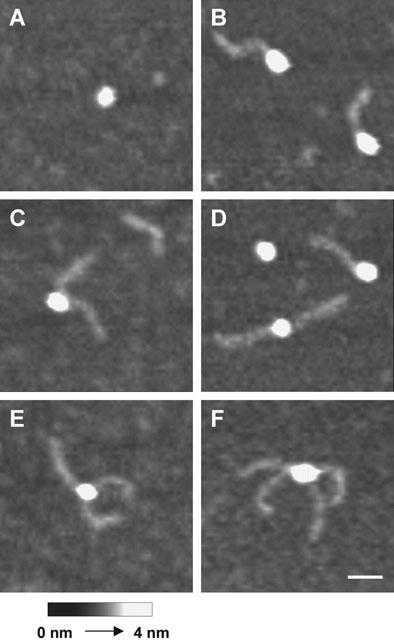
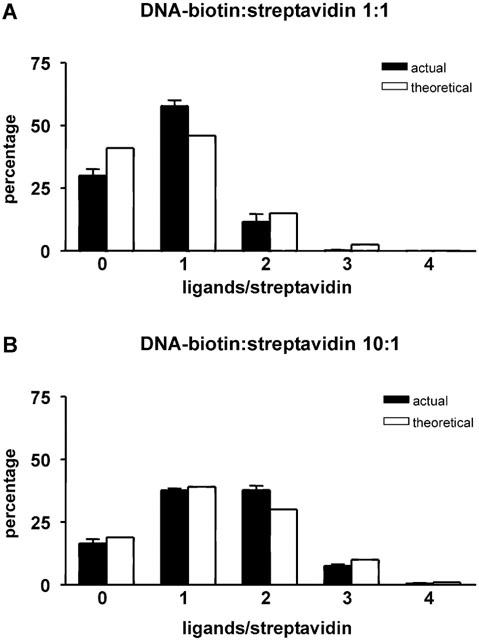
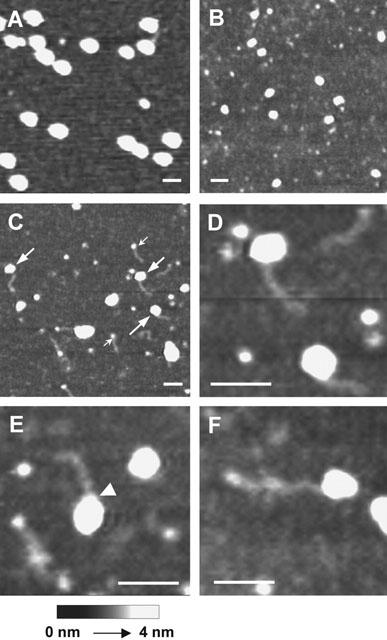
1. Streptavidin is a 60-kDa tetramer which binds four molecules of biotin with extremely high affinity (K(A) approximately 10(14) M(-1)). We have used atomic force microscopy (AFM) to visualize this ligand-protein interaction directly. 2. Biotin was tagged with a short (152-basepair; 50-nm) DNA rod and incubated with streptavidin. The resulting complexes were then imaged by AFM. The molecular volume of streptavidin calculated from the dimensions of the protein particles (105+/-3 nm(3)) was in close agreement with the value calculated from its molecular mass (114 nm(3)). Biotinylation increased the apparent size of streptavidin (to 133+/-2 nm(3)), concomitant with an increase in the thermal stability of the tetramer. 3. Images of streptavidin with one to four molecules of DNA-biotin bound were obtained. When two ligands were bound, the angle between the DNA rods was either acute or obtuse, as expected from the relative orientations of the biotin binding sites. The ratio of acute : obtuse angles (1 : 3) was lower than the expected value (1 : 2), indicating a degree of steric hindrance in the binding of the DNA-biotin. The slight under-representation of higher occupancy states supported this idea. 4. Streptavidin with a single molecule of DNA-biotin bound was used to tag biotinylated beta-galactosidase, a model multimeric enzyme. 5. The ability to image directly the binding of a ligand to its protein target by AFM provides useful information about the nature of the interaction, and about the effect of complex formation on the structure of the protein. Furthermore, the use of DNA-biotin/streptavidin tags could potentially shed light on the architecture of multi-subunit proteins.


Figures

Figure 1
Figure 1
Streptavidin and DNA-biotin imaged by tapping-mode AFM in air. (A) Streptavidin at a concentration of 5 nM was allowed to adsorb to mica at 22°C for 10 min. The mica was then washed with water and air-dried. (B) DNA-biotin at a concentration of 50 nM was adsorbed to mica as in (A). Scale bars: 50 nm. A shade-height scale is shown at the bottom.
Figure 2
Figure 2
Effect of biotinylation on the structure of streptavidin. (A) Scan of unoccupied streptavidin (5 nM) imaged by tapping-mode AFM in air. (B) Distribution of calculated molecular volumes of unoccupied streptavidin. Volumes were placed in 25-nm3 bins. (C) Scan of streptavidin complexed with biotin. Streptavidin (5 nM) was incubated with biotin (10 nM) for 1 h at 22°C before adsorption to mica. (D) Distribution of calculated molecular volumes of biotinylated streptavidin. (E) Scan of streptavidin complexed with DNA-biotin. Streptavidin (5 nM) was incubated with DNA-biotin (50 nM) for 1 h at 22°C before adsorption to mica. (F) Distribution of calculated molecular volumes of streptavidin complexed with DNA-biotin. Scale bars: 50 nm. A shade-height scale is shown at the bottom.
Figure 3
Figure 3
Effect of biotinylation on the thermal stability of streptavidin. Streptavidin, at a concentration of 10 μM, was incubated with biotin at biotin : streptavidin molar ratios of 0 : 1, 0.25 : 1, 0.5 : 1, 1 : 1 or 2 : 1 for 30 min at either 22°C (A) or 100°C (B). Samples were analysed by SDS-polyacrylamide gel electrophoresis, and proteins were visualized by staining with Coomassie brilliant blue. The positions of molecular mass markers (kDa) are shown on the right.
Figure 4
Figure 4
AFM images of streptavidin complexed with multiple DNA-biotin ligands. (A) Unoccupied streptavidin. (B) Streptavidin occupied by one DNA-biotin molecule. (C) Streptavidin occupied by two DNA-biotin molecules, with the DNA rods at an acute angle. (D) Streptavidin occupied by two DNA-biotin molecules, with the DNA rods at an obtuse angle. (E) Streptavidin occupied by three DNA-biotin molecules. (F) Streptavidin occupied by four DNA-biotin molecules, with two acute angles and two obtuse angles between the DNA rods. Scale bar: 25 nm. A shade-height scale is shown at the bottom.
Figure 5
Figure 5
Frequencies of the various forms of DNA-biotin liganding at DNA-biotin : streptavidin molar ratios of 1 : 1 (A) and 10 : 1 (B), compared with theoretical values. The concentration of streptavidin was 5 nM in each case. The histograms show the actual (filled bars) and theoretical (open bars) percentages of the various occupation states of streptavidin. Eight (A) or five (B) separate samples, containing a total of 1335 (A) or 1970 (B) streptavidin particles, were analysed. Errors refer to the variation between samples. The overall occupancies of the binding sites were 20±0.02% (A) and 34±0.01% (B).
Figure 6
Figure 6
Tagging of β-galactosidase by DNA-biotin/streptavidin. (A) β-galactosidase was reconstituted to a concentration of 5 nM, bound to mica and imaged immediately. (B) β-galactosidase was reconstituted to a concentration of 5 nM and left at 22°C for 6 h before imaging. (C – F) Streptavidin (5 nM) was incubated with DNA-biotin (5 nM) for 1 h at 22°C to produce complexes containing predominantly 1 DNA rod. These complexes were incubated for a further 1 h at 22°C with β-galactosidase (0.5 nM), and then bound to mica and imaged. Large arrows in C indicate β-galactosidase monomers tagged with single DNA-biotin/streptavidin complexes. Small arrows indicate unattached DNA-biotin/streptavidin complexes. The arrowhead in E indicates a ‘neck' on the protein complex produced by the attachment of a DNA-biotin/streptavidin molecule. Scale bars: 50 nm.

References

    1. BERGE T., ELLIS D.J., DRYDEN D.T.F., EDWARDSON J.M., HENDERSON R.M. Translocation-independent dimerization of the EcoKI endonuclease visualized by atomic force microscopy. Biophys. J. 2000;79:479–484. - PMC - PubMed
    1. COHEN R., MIRE M. Analytical-band centrifugation of an active enzyme-substrate complex. Determination of active subunits of various enzymes. Eur. J. Biochem. 1971;23:276–281. - PubMed
    1. DAVIES P.A., PISTIS M., HANNA M.C., PETERS J.A., LAMBERT J.J., HALES T.G., KIRKNESS E.F. The 5-HT3B subunit is a major determinant of serotonin-receptor function. Nature. 1999;397:359–363. - PubMed
    1. EDSTROM R.D., MEINKE M.H., YANG R., YANG X., ELINGS V., EVANS D.F. Direct visualization of phosphorylase-phosphorylase kinase complexes by scanning tunneling and atomic force microscopy. Biophys. J. 1990;58:1437–1448. - PMC - PubMed
    1. ELLIS D.J., BERGE T., EDWARDSON J.M., HENDERSON R.M. Investigation of protein partnerships using atomic force microscopy. Microsc. Res. Tech. 1999a;44:368–377. - PubMed

Publication types

MeSH terms

LinkOut - more resources