. 2002 Apr 16;99(8):5261-6.
doi: 10.1073/pnas.082089499.

Comprehensive human genome amplification using multiple displacement amplification

Affiliations

Comprehensive human genome amplification using multiple displacement amplification

Frank B Dean et al. Proc Natl Acad Sci U S A. .

Abstract

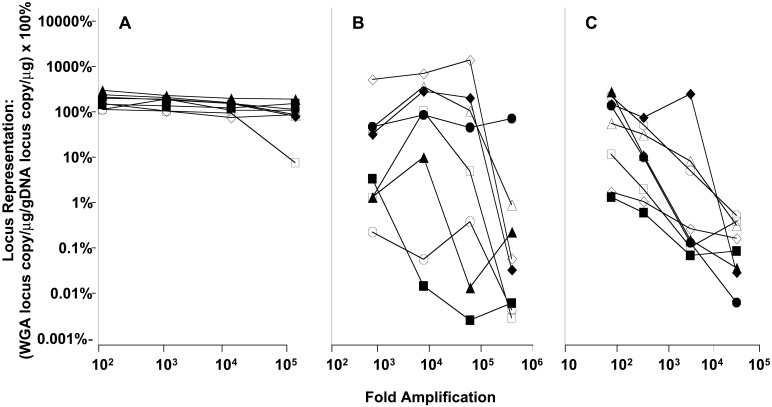
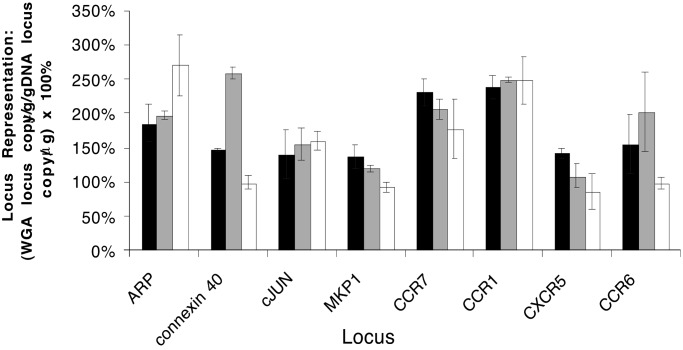
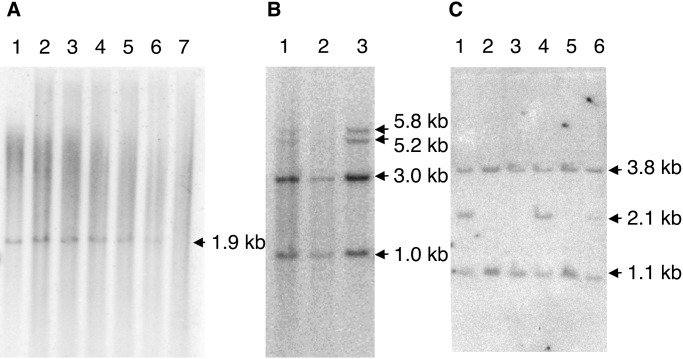
Fundamental to most genetic analysis is availability of genomic DNA of adequate quality and quantity. Because DNA yield from human samples is frequently limiting, much effort has been invested in developing methods for whole genome amplification (WGA) by random or degenerate oligonucleotide-primed PCR. However, existing WGA methods like degenerate oligonucleotide-primed PCR suffer from incomplete coverage and inadequate average DNA size. We describe a method, termed multiple displacement amplification (MDA), which provides a highly uniform representation across the genome. Amplification bias among eight chromosomal loci was less than 3-fold in contrast to 4-6 orders of magnitude for PCR-based WGA methods. Average product length was >10 kb. MDA is an isothermal, strand-displacing amplification yielding about 20-30 microg product from as few as 1-10 copies of human genomic DNA. Amplification can be carried out directly from biological samples including crude whole blood and tissue culture cells. MDA-amplified human DNA is useful for several common methods of genetic analysis, including genotyping of single nucleotide polymorphisms, chromosome painting, Southern blotting and restriction fragment length polymorphism analysis, subcloning, and DNA sequencing. MDA-based WGA is a simple and reliable method that could have significant implications for genetic studies, forensics, diagnostics, and long-term sample storage.


Figures

Figure 1
Figure 1
MDA strategy and product characterization. (A) Random-primed rolling circle amplification of circular DNA templates. DNA synthesis is initiated with random oligonucleotide primers. 3′ Ends are indicated by arrowheads. Thickened regions indicate primers. Secondary priming events occur on the displaced product DNA strands. (B) Scheme for MDA of genomic DNA. Secondary priming events are initiated from primary products. (C) Effect of template concentration on amplification yield. A total of 100 fg to 100 ng human genomic DNA was amplified by MDA at 30°C as described. Aliquots were taken from single reactions at the times indicated to quantitate DNA synthesis. ●, 10 ng genomic DNA template; ○, 1 ng; ▴, 100 pg; ▵, 10 pg; ■, 1 pg; □, 100 fg; ⧫, primers omitted. (D) Denaturing gel analysis of amplification product size. Radioactively labeled amplification products shown in C were electrophoresed through an alkaline agarose gel (1%), and the dried gel was exposed to a phosphor screen and imaged as described. Reaction products were loaded in order of increasing DNA template amount, as indicated above the gel.
Figure 2
Figure 2
Effect of amplification on gene representation bias. Amplification reactions omitted a heat denaturation step and were carried out as described. Reactions contained 300 ng, 30 ng, 3 ng, or 0.3 ng of template DNA. The relative representation of eight loci was determined by using TaqMan quantitative PCR. The x axis represents the fold amplification in the amplified DNA used as template for quantitative PCR; the y axis is the locus representation in the amplified DNA relative to the input genomic DNA, expressed as a percent, and is calculated as the yield of quantitative PCR product from 1 μg of amplified DNA divided by the yield from 1 μg of genomic DNA control. The results for eight loci are indicated as follows: CXCR5, ◊; connexin40, ▵; MKP1, □; CCR6, ○; acidic ribosomal protein, ⧫; CCR1, ▴; cJUN, ■; CCR7, ●. (A) Percent representation for eight loci derived from MDA-amplified DNA. (B) Percent representation for eight loci present in DNA amplified by using DOP-PCR. (C) Percent representation for eight loci present in PEP-amplified DNA.
Figure 3
Figure 3
Gene coverage comparison of MDA-amplified DNA from blood, tissue culture cells, and pure DNA. Quantitative PCR was used to measure the yield of specific DNA fragments in amplified DNA preparations relative to genomic DNA. Reactions omitted a heat denaturation step, and alkaline lysis of blood and cells was carried out as described. The representation of eight loci in the amplified samples relative to pure DNA was determined by using TaqMan quantitative PCR. Black bars depict the locus representation of DNA amplified directly from blood. Gray bars depict the locus representation of DNA amplified from purified genomic DNA (30 ng, representing 9,000 gene copies). White bars depict the locus representation of DNA amplified from tissue culture cells (10 cell equivalents of DNA).
Figure 4
Figure 4
Southern blot analysis of the human parathyroid hormone (PTH) and thyroglobulin genes and RFLP marker D13S2 for MDA-generated DNA target. (A) MDA reactions included a heat denaturation step and amplification was carried out as described. EcoRI DNA digests were probed by using a radioactively labeled genomic fragment of the PTH gene (p20.36) that hybridized to an ≈1.9-kb DNA fragment. The EcoRI-cleaved DNA preparations were genomic DNA, DNA amplified by MDA from varying amounts of input genomic DNA, as indicated, or an MDA reaction that lacked input genomic DNA template. The position of the 1.9-kb genomic DNA fragment is indicated (lane 1). Genomic DNA is shown: (lane 2) ×100, (lane 3) ×1,000, (lane 4) ×10,000, (lane 5) ×100,000, (lane 6) ×1,000,000, and (lane 7) 0 template. (B) MDA reactions included or omitted a heat denaturation step, as indicated, of genomic target DNA heterozygous for two thyroglobulin alleles, and amplification was carried out as described. TaqI DNA digests were probed by using a radioactively labeled genomic fragment of the thyroglobulin gene (pCHT.16/8) that hybridized to invariant 1-kb and 3-kb DNA fragments and a polymorphic 5.8-kb (allele A) or 5.2-kb (allele B) DNA fragment. The TaqI-cleaved DNA preparations were (lane 1) genomic DNA, (lane 2) DNA amplified by MDA reaction (×10,000) with a 95°C preheating step, and (lane 3) an MDA reaction (×10,000) without the preheating step. (C) Reactions lacked a heat denaturation step, but otherwise amplification was carried out as described. PstI DNA digests were probed by using a radioactively labeled genomic fragment of the RFLP marker D13S12 locus (p9D11) that hybridized to an invariant 3.8-kb DNA fragment and a polymorphic 2.1-kb (allele A) or 1.1-kb (allele B) DNA fragment. The PstI-cleaved DNA preparations were genomic DNA and five different patient DNAs amplified by MDA (×10,000 amplification): (lane 1) patient 5 (AB), (lane 2) patient 4 (BB), (lane 3) patient 3 (BB), (lane 4) patient 2 (AB), (lane 5) patient 1 (BB), and (lane 6) genomic DNA (AB). AB and BB represent the diploid genotypes of the D13512 locus.
Figure 5
Figure 5
Representation bias assessed by competitive genome hybridization to metaphase chromosomes. Amplification reactions included a heat denaturation step, and amplification was carried out as described. Amplified (100,000-fold) and unamplified DNA samples were nick-translated to incorporate biotin nucleotide and digoxigenin nucleotide, respectively. The probes were mixed in equimolar amounts of nucleotide and hybridized without CotI suppression. Specific signals were detected by avidin FITC (amplified DNA, green) and antidigoxigenin rhodamine (unamplified DNA, red).

References

    1. Telenius H, Carter N P, Bebb C E, Nordenskjold M, Ponder B A, Tunnacliffe A. Genomics. 1992;13:718–725. - PubMed
    1. Cheung V G, Nelson S F. Proc Natl Acad Sci USA. 1996;93:14676–14679. - PMC - PubMed
    1. Zhang L, Cui X, Schmitt K, Hubert R, Navidi W, Arnheim N. Proc Natl Acad Sci USA. 1992;89:5847–5851. - PMC - PubMed
    1. Paunio T, Reima I, Syvanen A C. Clin Chem. 1996;42:1382–1390. - PubMed
    1. Lizardi P M, Huang X, Zhu Z, Bray-Ward P, Thomas D C, Ward D C. Nat Genet. 1998;19:225–232. - PubMed