. 2002 Apr 16;99(8):5373-7.
doi: 10.1073/pnas.032095099.

Knotting probability of DNA molecules confined in restricted volumes: DNA knotting in phage capsids

Affiliations

Knotting probability of DNA molecules confined in restricted volumes: DNA knotting in phage capsids

Javier Arsuaga et al. Proc Natl Acad Sci U S A. .

Abstract

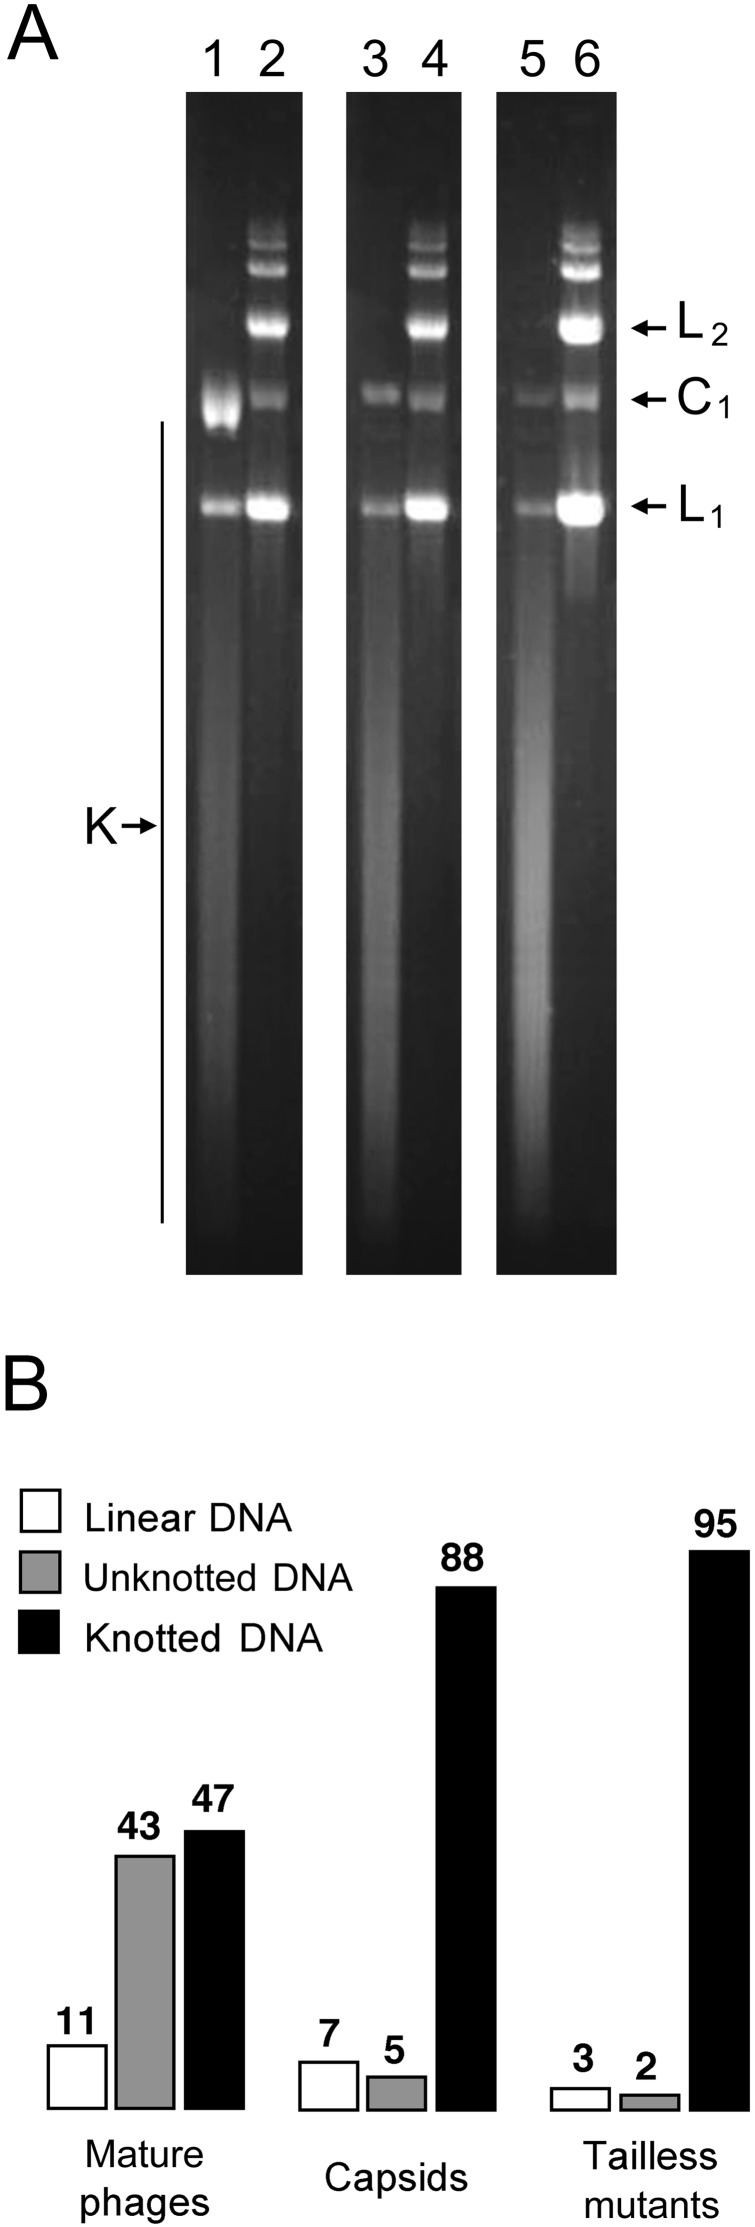
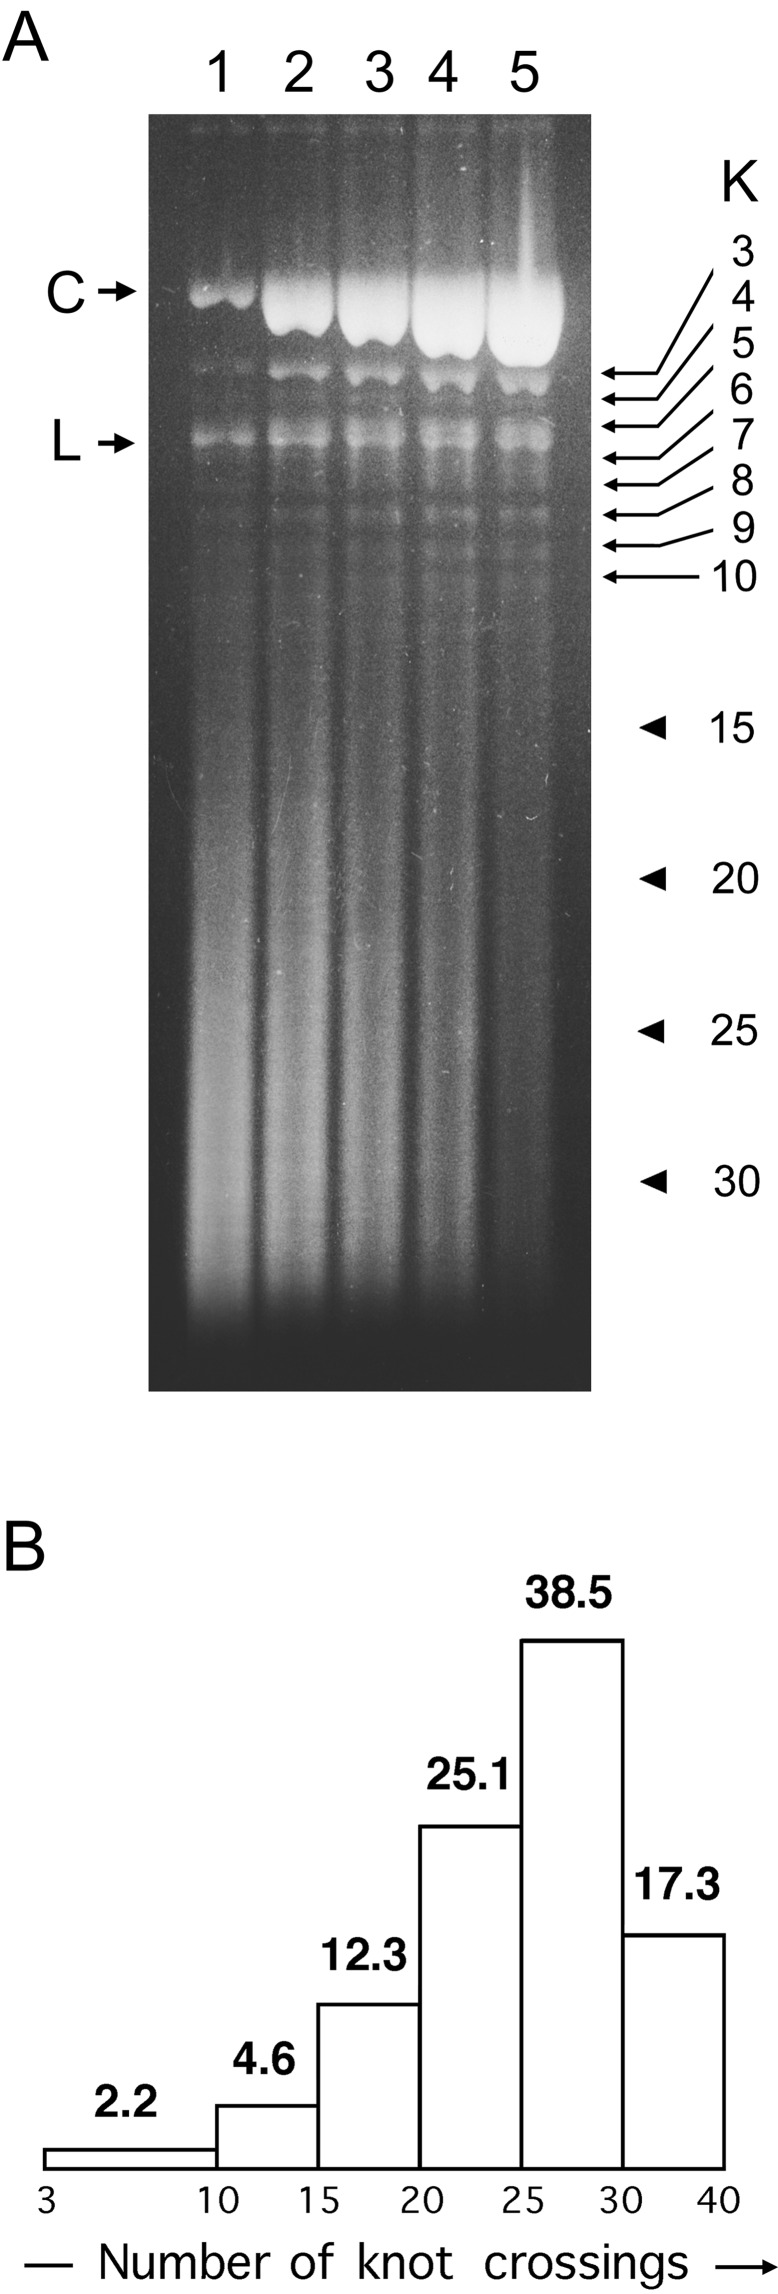
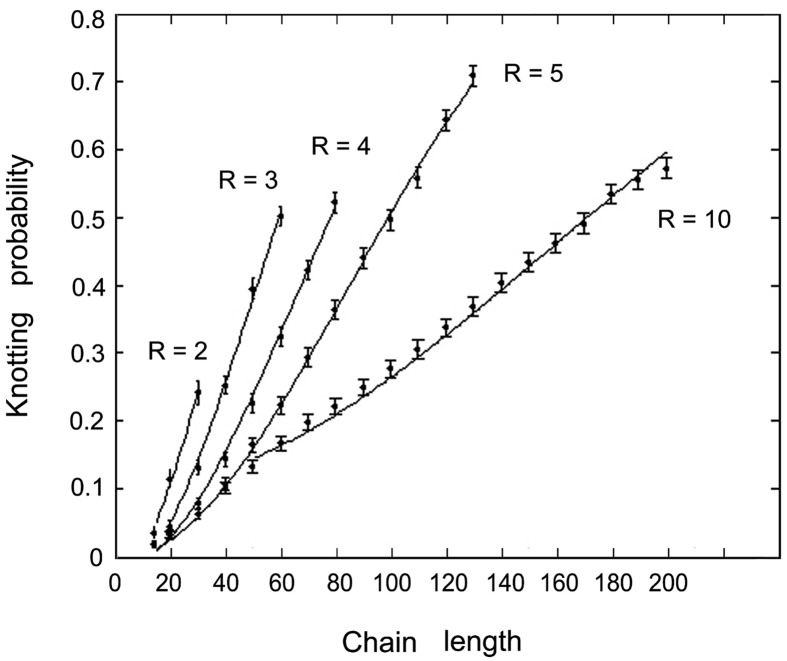
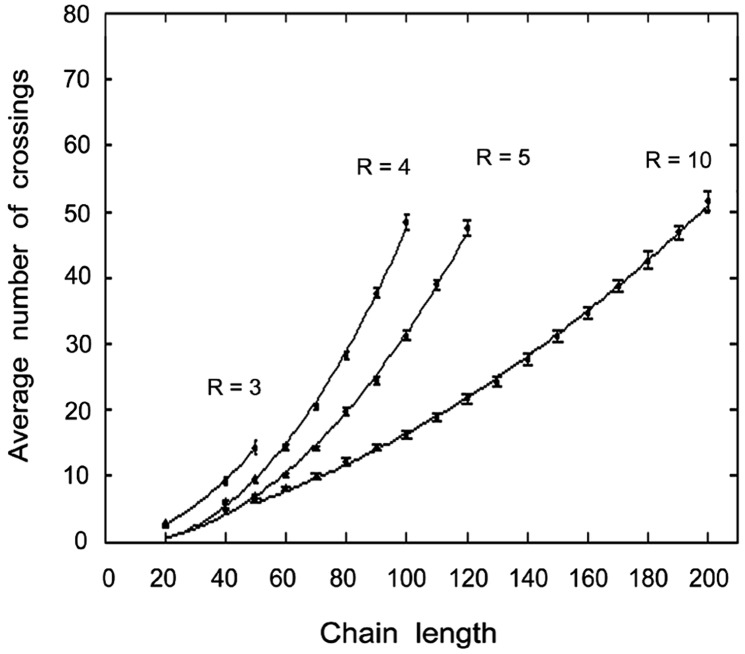
When linear double-stranded DNA is packed inside bacteriophage capsids, it becomes highly compacted. However, the phage is believed to be fully effective only if the DNA is not entangled. Nevertheless, when DNA is extracted from a tailless mutant of the P4 phage, DNA is found to be cyclic and knotted (probability of 0.95). The knot spectrum is very complex, and most of the knots have a large number of crossings. We quantified the frequency and crossing numbers of these knots and concluded that, for the P4 tailless mutant, at least half the knotted molecules are formed while the DNA is still inside the viral capsid rather than during extraction. To analyze the origin of the knots formed inside the capsid, we compared our experimental results to Monte Carlo simulations of random knotting of equilateral polygons in confined volumes. These simulations showed that confinement of closed chains to tightly restricted volumes results in high knotting probabilities and the formation of knots with large crossing numbers. We conclude that the formation of the knots inside the viral capsid is driven mainly by the effects of confinement.


Figures

Figure 1
Figure 1
Knotting probability of DNA extracted from different P4 phage particles. (A) Electrophoretic analysis of DNA extracted from P4 mature phages (lanes 1 and 2), P4 capsids (lanes 3 and 4), and P4 tailless mutants (lanes 5 and 6). In the odd lanes, purified DNA was loaded directly. In the even lanes, DNA was heated at 75°C for 5 min before loading in the gel. Electrophoresis was done in a 0.4% agarose gel and run at 35 V for 38 h. The positions of knotted DNA (K), linear monomers (L1), linear dimers (L2), and circular unknotted monomers (C1) are indicated. (B) Relative amounts (%) of knotted, circular unknotted, and linear DNA extracted from mature phages, capsids, and tailless capsids.
Figure 2
Figure 2
Analysis of knot complexity in DNA molecules from P4 tailless mutants. (A) Time course unknotting of DNA by yeast topoisomerase II. Unknotting reactions were set as described in Materials and Methods and stopped at the following time points: 0 (lane 1), 30 (lane 2), 60 (lane 3), 120 (lane 4), and 240 sec (lane 5). These samples were electrophoresed in a 0.4% agarose gel that ran at 25 V for 45 h. The positions of linear DNA (L), unknotted circular DNA (C), and knotted circles (K) are indicated. Small arrows point to discernible bands of knotted circles with 3–10 crossings. Arrow heads point to the expected migration of knotted circles with 15, 20, 25, and 30 crossings, assuming a direct correlation between knot complexity and electrophoretic velocity. (B) Histogram of the knot complexity (number of crossings) of DNA extracted from P4 tailless mutants. The numbers at the top of each bar are percentages of the total amount of knotted molecules.
Figure 3
Figure 3
Knotting probabilities of ideal equilateral chains confined to spheres of different radii as a function of the chain length. Chain lengths varied from 14 to 200 segments. Values of the radius (r), measured as the number of chain segments, of the confining sphere ranged from 2 to infinity. The figure shows the knotting probability for r = 2, 3, 4, 5, and 10. Error bars represent the SD for the observations made along the dynamic Markov chain (33).
Figure 4
Figure 4
Knot complexity of simplified diagrams as a function of chain length, measured as number of chain segments, in a confined volume of radius (r). The length of the chains varied from 20 to 200 segments. For each selected configuration the average number of crossings of the simplified diagrams, taken over 100 projections, was computed. This value is an upper bound for the crossing number of that configuration and approximates it. This process was repeated for all selected configurations along the Markov chain and averaged over the total number of analyzed configurations. The figure shows the variation of knot complexity (average number of crossings) for r = 3, 4, 5, and 10. Error bars were computed by using methods from time-series analysis (33).

References

    1. Rybenkov V V, Cozzarelli N R, Vologodskii A V. Proc Natl Acad Sci USA. 1993;90:5307–5311. - PMC - PubMed
    1. Shaw S Y, Wang J C. Science. 1993;260:533–536. - PubMed
    1. Wasserman S A, Cozzarelli N R. Science. 1986;232:951–960. - PubMed
    1. Stark W M, Boocock M R, Sherratt D J. Trends Genet. 1989;5:304–309. - PubMed
    1. Frank-Kamentskii M D, Lukashin A V, Anshelevich V V, Vologodskii A V. J Biomol Struct Dyn. 1985;2:1005–1012. - PubMed

Publication types