Comparative Study
. 2002 May;11(5):1017-25.
doi: 10.1110/ps.4330102.

Direct comparison of binding equilibrium, thermodynamic, and rate constants determined by surface- and solution-based biophysical methods

Affiliations
Comparative Study

Direct comparison of binding equilibrium, thermodynamic, and rate constants determined by surface- and solution-based biophysical methods

Yasmina S N Day et al. Protein Sci. 2002 May.

Abstract

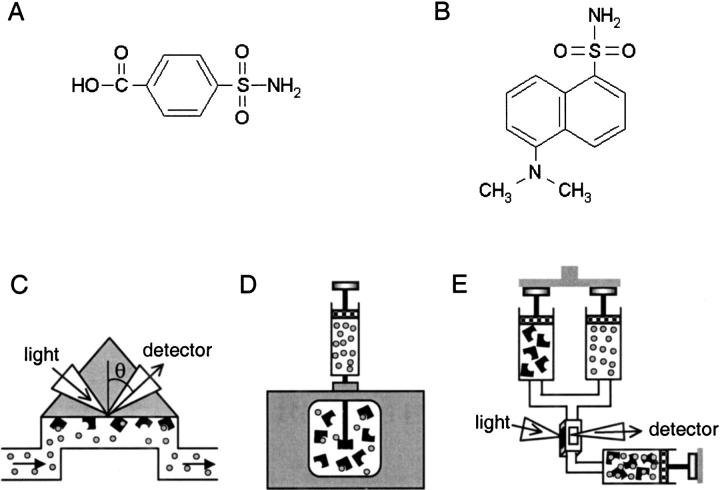
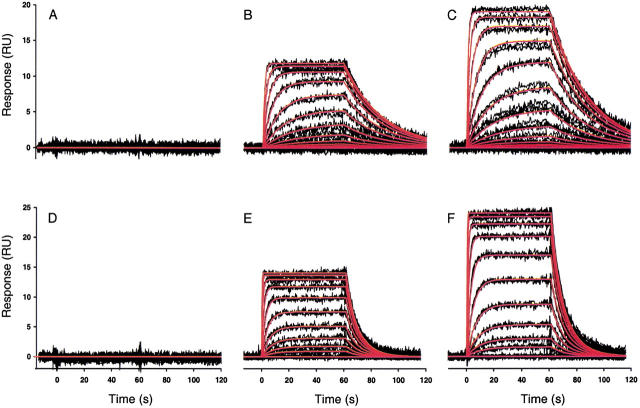
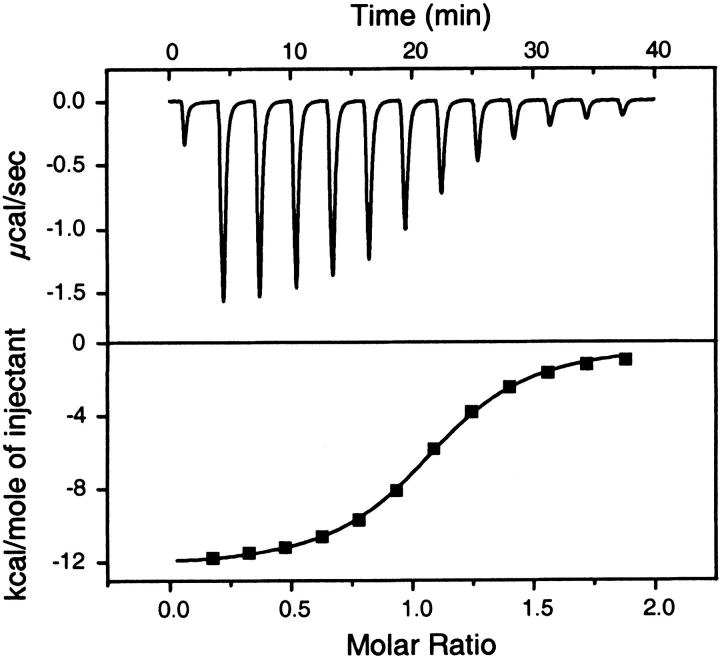
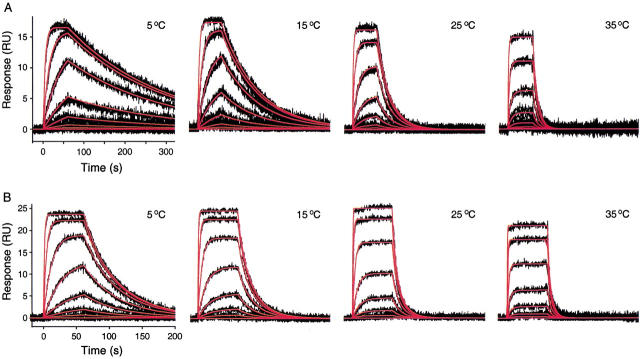
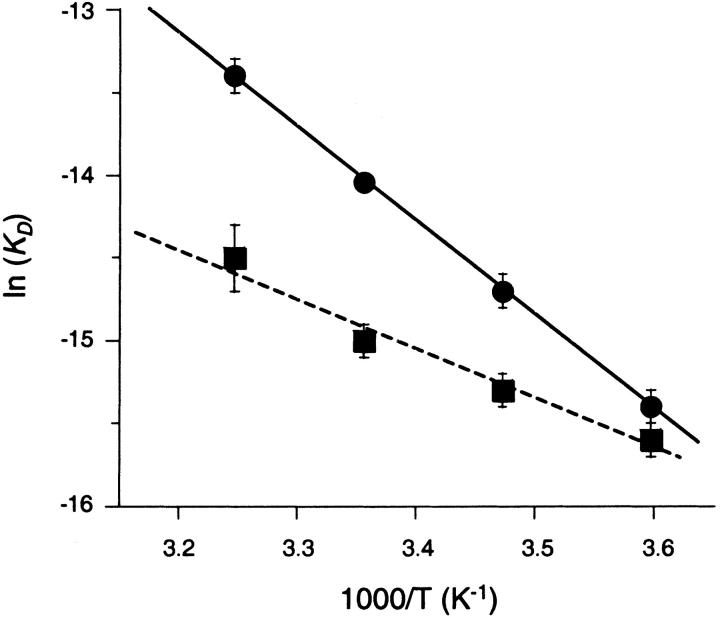
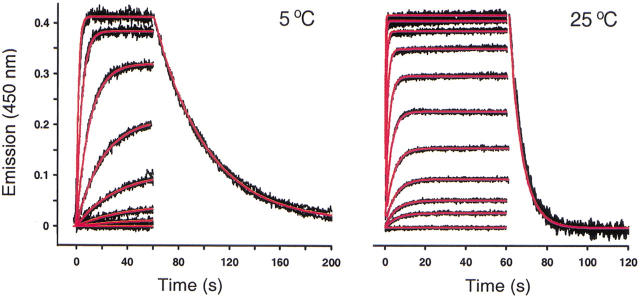
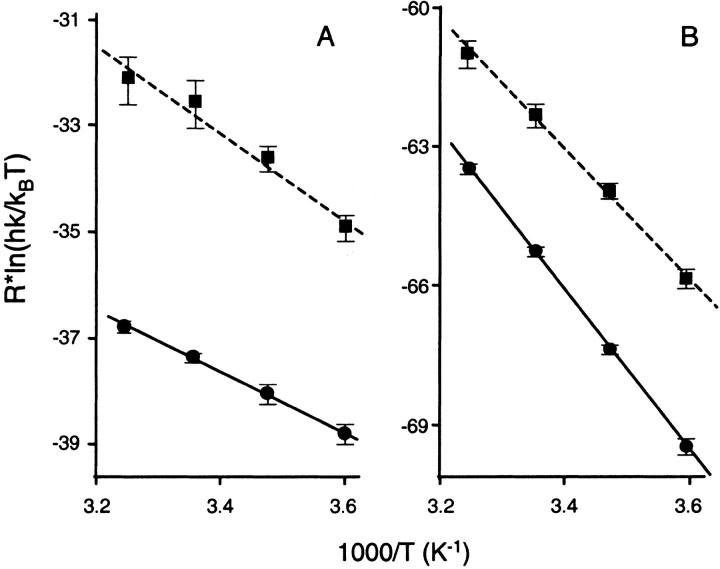
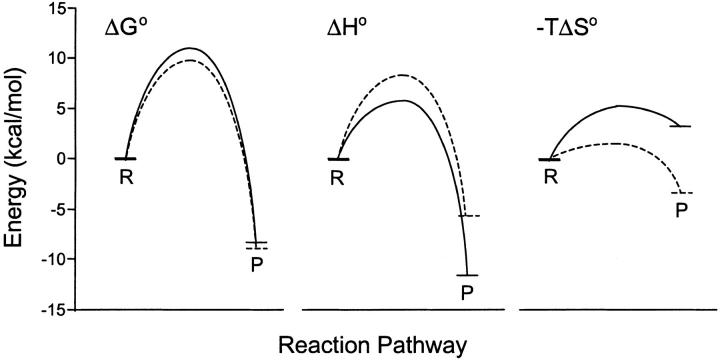
The binding interactions of small molecules with carbonic anhydrase II were used as model systems to compare the reaction constants determined from surface- and solution-based biophysical methods. Interaction data were collected for two arylsulfonamide compounds, 4-carboxybenzenesulfonamide (CBS) and 5-dimethyl-amino-1-naphthalene-sulfonamide (DNSA), binding to the enzyme using surface plasmon resonance, isothermal titration calorimetry, and stopped-flow fluorescence. We demonstrate that when the surface plasmon resonance biosensor experiments are performed with care, the equilibrium, thermodynamic, and kinetic constants determined from this surface-based technique match those acquired in solution. These results validate the use of biosensor technology to collect reliable data on small molecules binding to immobilized macromolecular targets. Binding kinetics were shown to provide more detailed information about complex formation than equilibrium constants alone. For example, although carbonic anhydrase II bound DNSA with twofold higher affinity than CBS, kinetic analysis revealed that CBS had a fourfold slower dissociation rate. Analysis of the binding and transition state thermodynamics also revealed significant differences in the enthalpy and entropy of complex formation. The lack of labeling requirements, high information content, and high throughput of surface plasmon resonance biosensors will make this technology an important tool for characterizing the interactions of small molecules with enzymes and receptors.


Figures

Fig. 1.
Fig. 1.
Structures of the two arylsulfonamides and schematics of the three biophysical techniques used in this analysis. The interactions of either (A) 4-carboxybenzenesulfonamide (CBS) or (B) dansylamide (DNSA), with carbonic anhydrase II (CA II), were analyzed by (C) surface plasmon resonance (SPR), (D) isothermal titration calorimetry (ITC), and (E) stopped-flow fluorescence (SFF). In each assay, the compounds are denoted as circles and the protein is indicated as a black shape. In the ITC study of the CA II/DNSA interaction, however, the orientation of the assay was reversed to accommodate the low aqueous solubility of DNSA.
Fig. 2.
Fig. 2.
High-resolution kinetic analysis of the binding of CBS and DNSA to CA II surfaces using a Biacore 2000 biosensor. Black lines show biosensor data collected at 25°C for triplicate injections of CBS (12 nM to 25 μM) (A–C) and DNSA (20 nM to 10 μM) (D–F), across a nonderivatized surface (A and D) and two surfaces derivatized with different densities of CA II, 2400 RU (B and E) and 4600 RU (C and F). Sulfonamide concentrations were prepared by twofold serial dilutions in PBS buffer at pH 7.4. Red lines indicate the global fits obtained for both systems. CBS binding data were fit to a 1:1 interaction model, A + B = AB, whereas DNSA binding data were fit to a mass transport model, A0 = A, A + B = AB, due to its faster association rate.
Fig. 3.
Fig. 3.
ITC data for the CA II/CBS interaction. The upper panel shows the rate of heat released as a function of time from 10-μL injections of 400 μM CBS titrated into a cell containing 20 μM CA II, measured at 25°C. The lower panel shows the integrated areas under the respective peaks in the top panel plotted against the molar ratio of CBS titrated into CA II. The calculated best-fit binding isotherm is shown in the lower panel.
Fig. 4.
Fig. 4.
Temperature dependence of the biosensor binding response for CA II/compound interactions. (A) The black lines represent the biosensor responses obtained for a concentration series of CBS (40 nM to 10 μM) injected in triplicate across a CA II surface (4300 RU) at 5, 15, 25, and 35°C (see Materials and Methods). The red lines represent global fits to a simple bimolecular interaction model (A + B = AB). (B) The black lines represent duplicate injections of DNSA (7 nM to 5 μM) across a CA II surface (4200 RU) at 5, 15, 25, and 35°C. The red lines show the fits to a mass transport model (A0 = A, A + B = AB).
Fig. 5.
Fig. 5.
van't Hoff plots for the CA II/CBS and CA II/DNSA interactions, determined from biosensor analysis. Circles and squares indicate data points for CBS and DNSA, respectively. The solid line shows a linear fit of three replicate CBS data sets, which yielded ΔH = −11.6 ± 0.4 kcal•mol−1, ΔS = −11 ± 1 cal mol−1 K−1, and a correlation coefficient of 0.9875 (1 indicates a perfect fit). The dashed line indicates a linear fit of 10 replicate DNSA data sets, which yielded ΔH = −5.7 ± 0.4 kcal mol−1 and ΔS = 11 ± 1 cal mol−1 K−1, and a correlation coefficient of 0.8863.
Fig. 6.
Fig. 6.
Kinetic analysis of the CA II/DNSA interaction as measured by SFF. The black lines represent four independent fluorescence traces generated for the interaction between CA II and DNSA at 5 and 25°C. In the association study, the final concentrations achieved by rapidly mixing the reactants were 5 nM CA II and (5°C) 60 nM to 5 μM DNSA and (25°C) 39 nM to 20 μM DNSA. A dissociation curve for the highest DNSA concentration was determined in a separate experiment, and is shown for each data set. Global fits to a single-site interaction model are shown in red.
Fig. 7.
Fig. 7.
Eyring plots for CA II/CBS and CA II/DNSA interactions in terms of (A) ka and (B) kd, determined from biosensor analyses. Circles and squares indicate data points for CBS and DNSA respectively. Solid and dashed lines denote the fits to the CBS and DNSA data, respectively.
Fig. 8.
Fig. 8.
Free energy profiles for CA II interactions. Plots show ΔG°, ΔH°, and −TΔS° for CA II interactions with CBS (solid curves) and DNSA (dashed curves), derived from the van't Hoff and Eyring analysis. Reactant and product states are indicated by R and P, respectively.

References

    1. Chegwidden, W.R. and Carter, N.D. 2000. Introduction to the carbonic anhydrases. In The carbonic anhydrases: New horizons (eds. W.R. Chegwidden, N.D. Carter, and Y.H. Edwards), pp. 13–28. Birkhauser Verlag, Basel.
    1. Hämäläinen, M.D., Markgren, P.-O., Schaal, W., Karlén, A., Classon, B., Vrang, L., Samuelsson, B., Hallberg, A., and Danielson, U.H. 2000. Characterization of a set of HIV-1 protease inhibitors using binding kinetics data from a biosensor-based screen. J. Biomol. Screen. 5 353–360. - PubMed
    1. Johnsson, B., Löfås, S., and Lindquist, G. 1991. Immobilization of proteins to a carboxymethyldextran-modified gold surface for biospecific interaction analysis in surface plasmon resonance sensors. Anal. Biochem. 198 268–277. - PubMed
    1. Kampranis, S.C., Gormley, N.A., Tranter, R., Orphanides, G., and Maxwell, A. 1999. Probing the binding of coumarins and cyclothialidines to DNA gyrase. Biochemisty 38 1967–1976. - PubMed
    1. Karlsson, R., Kullman-Magnusson, M., Hämäläinen, M.D., Remaeus, A., Andersson, K., Borg, P., Gyzander, E., and Deinum, J. 2000. Biosensor analysis of drug–target interactions: Direct and competitive binding assays for investigation of interactions between thrombin and thrombin inhibitors. Anal. Biochem. 278 1–13. - PubMed

Publication types

Substances