. 2002 May;11(5):1036-49.
doi: 10.1110/ps.4220102.

Exploring protein aggregation and self-propagation using lattice models: phase diagram and kinetics

Affiliations

Exploring protein aggregation and self-propagation using lattice models: phase diagram and kinetics

R I Dima et al. Protein Sci. 2002 May.

Abstract

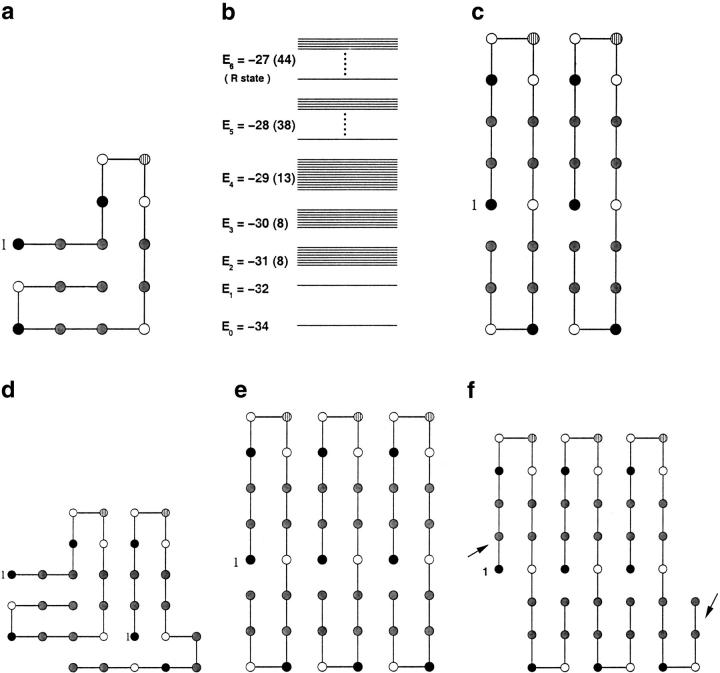
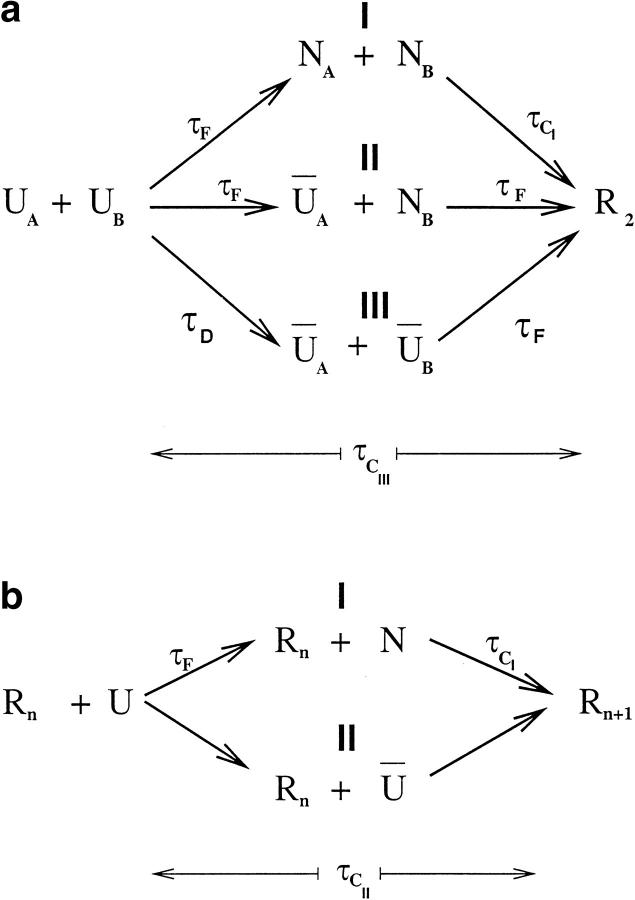
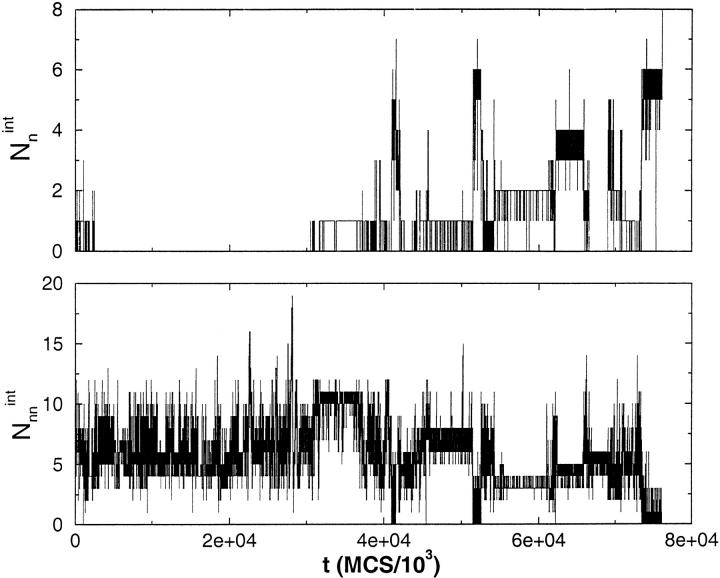
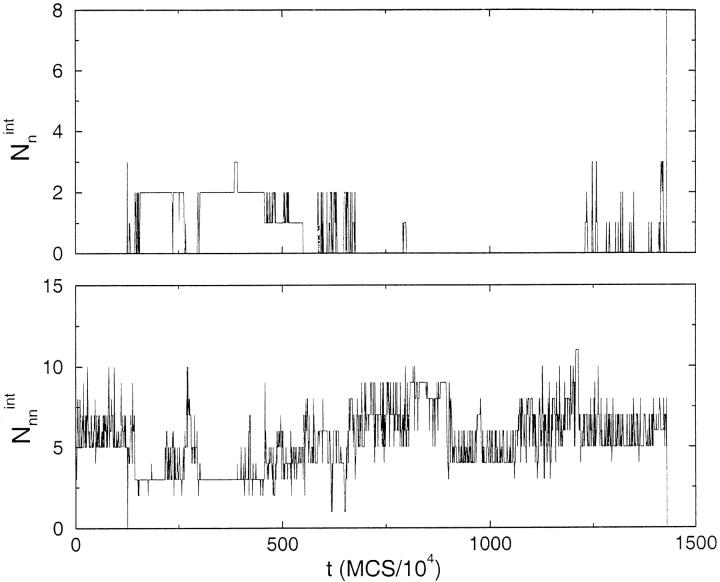
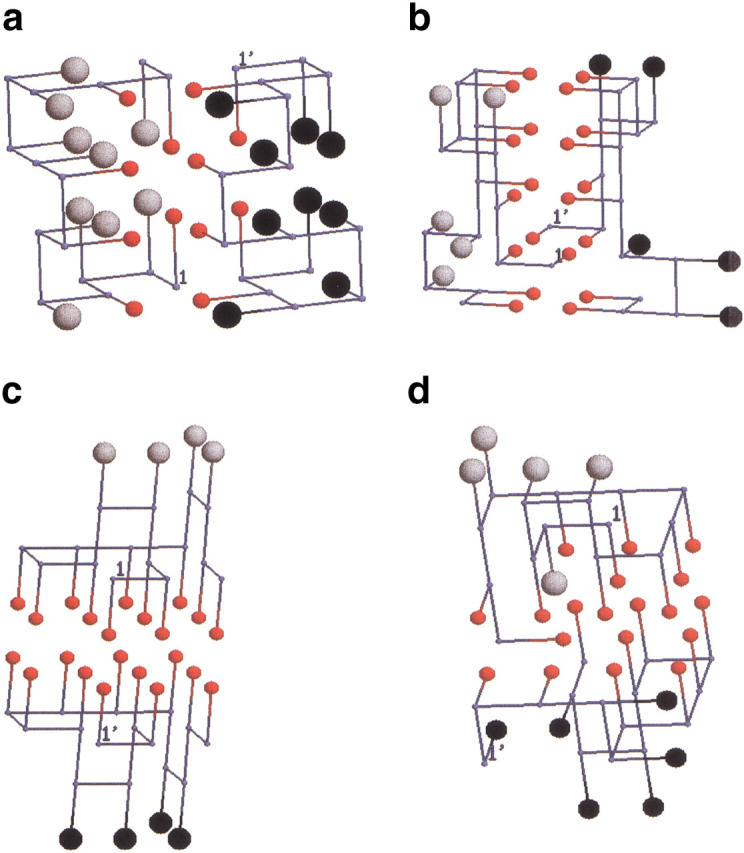
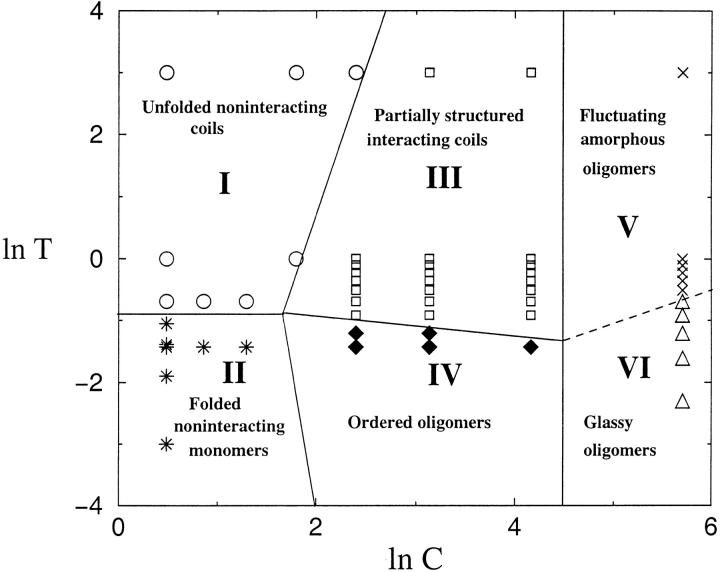
Many seemingly unrelated neurodegenerative disorders, such as amyloid and prion diseases, are associated with propagating fibrils whose structures are dramatically different from the native states of the corresponding monomers. This observation, along with the experimental demonstration that any protein can aggregate to form either fibrils or amorphous structures (inclusion bodies) under appropriate external conditions, suggest that there must be general principles that govern aggregation mechanisms. To probe generic aspects of prion-like behavior we use the model of Harrison, Chan, Prusiner, and Cohen. In this model, aggregation of a structure, that is conformationally distinct from the native state of the monomer, occurs by three parallel routes. Kinetic partitioning, which leads to parallel assembly pathways, occurs early in the aggregation process. In all pathways transient unfolding precedes polymerization and self-propagation. Chain polymerization is consistent with templated assembly, with the dimer being the minimal nucleus. The kinetic effciency of R(n-1) + G --> R(n) (R is the aggregation prone state and G is either U, the unfolded state, or N, the native state of the monomer) is increased when polymerization occurs in the presence of a "seed" (a dimer). These results support the seeded nucleated-polymerization model of fibril formation in amyloid peptides. To probe generic aspects of aggregation in two-state proteins, we use lattice models with side chains. The phase diagram in the (T,C) plane (T is the temperature and C is the polypeptide concentration) reveals a bewildering array of "phases" or structures. Explicit computations for dimers show that there are at least six phases including ordered structures and amorphous aggregates. In the ordered region of the phase diagram there are three distinct structures. We find ordered dimers (OD) in which each monomer is in the folded state and the interaction between the monomers occurs via a well-defined interface. In the domain-swapped structures a certain fraction of intrachain contacts are replaced by interchain contacts. In the parallel dimers the interface is stabilized by favorable intermolecular hydrophobic interactions. The kinetics of folding to OD shows that aggregation proceeds directly from U in a dynamically cooperative manner without populating partially structured intermediates. These results support the experimental observation that ordered aggregation in the two-state folders U1A and CI2 takes place from U. The contrasting aggregation processes in the two models suggest that there are several distinct mechanisms for polymerization that depend not only on the polypeptide sequence but also on external conditions (such as C, T, pH, and salt concentration).


Figures

Fig. 1.
Fig. 1.
Conformations of the HCPC model sequence (AHHABPBHHBHHABHH), which consists of 16 beads made from a four-letter alphabet adapted from Harrison et al. (2001). The first residue is numbered. (a) The native state of the compact monomer. (b) Energy spectrum of the 16-mer sequence. The self-propagating R conformation is one of the 44 folds of the sixth excited state. (c) The "minimal" propagating unit R2 that forms whenever two monomers are in the R state. The R2 conformation is stabilized by eight interface contacts. Its energy is −87 (−43.5 per chain). (d) An alternative conformation of the dimer that has the same energy as R2. One of the chains is in the native conformation of the monomer. (e) The structure of R3, which shows the way self-propagation occurs in this model. Its energy is −147 (−49 per chain). (f) Structure of the domain-swapped trimer R3DS. Although this structure can self-propagate, it does not do so for lack of stability. The domain-swapped structure in this model has "dangling ends" (indicated by arrows) that decrease its stability.
Fig. 2.
Fig. 2.
(a) Three parallel routes leading to the dimer R2 starting from an ensemble of denatured states. The symbols ŨA and ŨB denote collapsed denatured states of chains A and B, respectively. In pathway I both chains fold to the native conformation and subsequently dimerize, whereas in pathway II only one of the chains folds. In both these pathways dimerization is preceded by substantial unfolding of the folded chains. Kinetically, the most assembly occurs when R2 is formed directly from ŨA and ŨB. The time for forming ŨA from U, namely τD, is much less than τF, that is, τTF ≫ 1. The flux of molecules φi (i = 1, 2, and 3) through the pathways depends on temperature. At T = TF the values are φ1 = 36% (58%), φ2 = 40% (23%), φ3 = 24% (19%), where the numbers in parenthesis are for T = TH. Also, at T = TF the average conversion times are τCI ∼ 30 τF, while τCIII ⋍ 2 τF and at T = TH τCI ∼ 10 τF and τCIIIF, where τF is the monomeric folding time. (b) The two pathways in the templated assembly (TA) of Rn−1 + URn (n ≥ 3). Because N has to unfold prior to assembly, the conversion time along pathway I is greater than along pathway II. Just as in (a), the amplitudes of the fast and slow pathways depend on T . At T = TH, they are 75% (for I) and 25% (for II). The average conversion time for pathway I is ∼100 τF, while for II it is τCII ∼ τF.
Fig. 3.
Fig. 3.
Time evolution of the number of native and non-native contacts (eq. 3) at the interface between two chains along a trajectory that reaches R2 through pathway I (Fig. 2a ▶) at T = TH = 1.41. Only late in the conversion process (t≈7 × 10⁷ MCS) all native interface contacts form and Nnnint → 0. The vanishing of Nnnint requires substantial unfolding.
Fig. 4.
Fig. 4.
Same as Figure 3 ▶ except it is for a trajectory following pathway II (Fig. 2a ▶). Just as in Figure 3 ▶, there is a substantial number of Nnnint until the assembly process is complete. The native interface contacts form only late in the conversion process, suggesting that R2 formation may involve formation of a "nucleus" of native interface contacts.
Fig. 5.
Fig. 5.
Dynamics of Nnint and Nnnint for a trajectory that reaches R2 directly from compact denatured states (Fig. 2a ▶). The dynamics is qualitatively different from those in Figures 3 and 4 ▶ ▶. Relatively early in the assembly process nearly 50% of Nnint are formed. There are fluctuations around this value along the trajectory. Interestingly, for the major portion of the trajectory, Nnnint is less than in pathways I and II. Because native interface contacts dominate in this pathway, in this case the conversion time almost coincides with τF, which is the monomer folding time.
Fig. 6.
Fig. 6.
Distinct conformations of ordered dimers found in lattice models with side chains. They are in region IV of the phase diagram (see Fig. 7 ▶). The monomer sequence of the 15-mer is WVVEKWHYYVANNAV. The residues that form contacts at the interface between the chains are represented by medium-sized red spheres, while the backbone beads are given as small gray circles. (a) The structure of the ordered dimer (OD). In the OD each chain is in the folded state of the monomer. The dimer is stabilized by eight interface contacts, which gives it a total energy of −33.4. (b) Domain-swapped (DS) dimer in which certain number of intrachain side chain–side chain (sc–sc) contacts are replaced by interchain sc–sc contacts. Because this involves interpenetration of chains, the transition from DS to either OD or PD involves overcoming a substantial free energy barrier. (c) In the PD conformation the hydrophobic side chains from one chain line up in parallel to the side chains of the other chain. This kind of structure may be similar to a dimer of Aβ peptide fragments (Aβ16–22) in which two chains can form parallel or antiparallel β-sheets that are stabilized by favorable intermolecular hydrophobic interactions and possible salt bridges. (d) An example of another ordered structure, the variant dimer (VD) that forms when topologically forbidden interactions (see Materials and Methods) for a monomer (a connected chain) are allowed for interacting chains. The VD may be an artifact of the lattice models.
Fig. 7.
Fig. 7.
Phase diagram in the (T,C) plane for a generic two-state folder. A rich set of phases, including ordered oligomers and amorphous structures, is predicted. The solid lines separating the phases are drawn to guide the eye. The symbols indicate the structures obtained by energy minimization for a dimer (whose monomeric sequence is given in Fig. 6 ▶) (see Materials and Methods for details). The dashed line, separating regions V and VI, is meant to indicate that there are distinct amorphous structures. These can be distinguished by morphology as well as kinetics. There are substructures in the ordered region (see text). The boundaries between them (OD, PD, DS) are difficult to compute numerically.
Fig. 8.
Fig. 8.
Dynamics of dimerization in a trajectory monitoring the formation of the ordered dimer OD starting from U at T = 0.24 (TF = 0.26 for the monomer). The value of C corresponds to Rcm =4.50 (eq. 6). The folding time for the monomer is 2 × 10⁶ MCS. (a) Plot of the time dependence of χs (eqs. 8 and 9) that monitors the formation of a single chain in the conformation that it takes in the oligomer. In the OD, the individual chains fold to N, the native monomeric state. At t ≈ 15 τF, the order parameter χs ≈ 0 in a dynamically cooperative manner. This shows that the chain folds to N. (b) Time dependence of χint (eq. 10) that probes the formation of the native interface between the chains. As in (a) χint ≈ 0 occurs at t ≈ 15 τF, which shows that the formation of all native intra- and interchain contacts occurs cooperatively. Both plots show that there are fluctuations within the basin of attraction corresponding to OD.

References

    1. Balbach, J.J., Ishii, Y., Antzntkin, O.N., Leapman, R.D., Rizzo, N.W., Dyda, F., Reed, J., and Tycko, R. 2000. Amyloid fibril formation by Aβ16–22, a seven-residue fragment of the Alzhemier's β-Amyloid peptide, and structural characterization by solid state NMR. Biochemistry 34 13748–13759. - PubMed
    1. Bennett, M.J., Schlunegger, P.M., and Eisenberg D. 1995. 3D domain swapping: A mechanism for oligomer assembly. Protein Sci. 4 2455–2468. - PMC - PubMed
    1. Bessen, R.A., Kocisko, D.A., Raymond, G.J., Nandan, S., Lansbury, P.T., and Caughey, B. 1995. Non-genetic propagation of strain-specific properties of scrapie prion protein. Nature 375 698–700. - PubMed
    1. Booth, D.R., Sunde, M., Belotti, V., Robinson, C.V., Hutchinson, W., Fraser, P.E., Hawkins, P.W., Dobson, C.M., Raiford, S.E., and Blake, C.C. 1997. Instability, unfolding and aggregation of human lysozyme variants underlying amyloid fibrilogenesis. Nature 385 787–793. - PubMed
    1. Broglia, R.A., Tiana, G., Pasquali, S., Roman, H.E., and Vigezzi, E. 1998. Folding and aggregation of designed proteins. Proc. Natl. Acad. Sci. 95 12930–12933. - PMC - PubMed

Publication types

LinkOut - more resources