Comparative Study
. 2002 Apr 30;41(17):5548-55.
doi: 10.1021/bi011864f.

Structure of the transition state of gating in the acetylcholine receptor channel pore: a phi-value analysis

Affiliations
Comparative Study

Structure of the transition state of gating in the acetylcholine receptor channel pore: a phi-value analysis

Gisela D Cymes et al. Biochemistry. .

Abstract

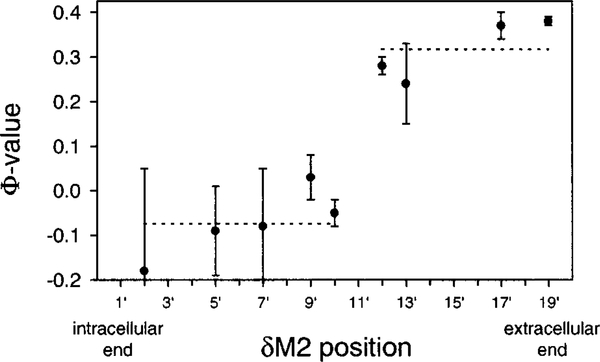
The gating mechanism of the acetylcholine receptor channel (AChR) was investigated by using rate equilibrium linear free energy relationships (LFERs) to probe the transition state between the closed and open conformations. The properties of the transition state of gating in the second transmembrane segment (M2) of the delta subunit, one of the five homologous pore-lining segments, was measured on a residue-by-residue basis. Series of point mutations were engineered at individual positions of this domain, and the corresponding constructs were characterized electrophysiologically, at the single-channel level. Fully liganded AChR opening and closing rate constants were estimated, and Phi-values (which are a measure of the extent of the conformational change realized at the transition state) were calculated for each reaction series as the slope of the Brønsted relationship (log rate constant versus log equilibrium constant). Our results indicate that, at the transition state of gating, the extracellular half of deltaM2 partly resembles the open state (Phi-values between 0.24 and 0.38) while the intracellular half completely resembles the closed state (Phi-values between -0.18 and 0.03), with a break point near the middle of the M2 segment. This suggests that during gating the two halves of deltaM2 move asynchronously, with the rearrangement of the extracellular portion preceding (following) that of the intracellular part of deltaM2 during opening (closing). This particular sequence of molecular events indicates that the gating conformational change, which starts at the extracellular acetylcholine-binding sites (when opening), does not propagate exclusively along the primary sequence of the protein. In addition, our data are consistent with the deltaM2 segment bending or swiveling around its central residues during gating. We also elaborate on unsettled aspects of the analysis such as the accuracy of two-point LFERs, the physical interpretation of fractional Phi-values, and the existence of single versus parallel transition states for the gating reaction.


Figures

Figure 1:
Figure 1:
Single-channel kinetic analysis. (A, left) Example single-channel currents from the wild type and some of the δM2 mutants in the presence of 20 mM choline at a membrane potential of ~–100 mV. δM2 positions are numbered 1′–19′ from the intracellular to the extracellular end. For display purposes, the data were digitally filtered at 3 kHz. Openings are downward deflections. (B, right) Dwell time histograms and computed density functions. The closed time histograms correspond to currents elicited by 20 mM choline. The open time histograms correspond to currents elicited by 200 μM choline.
Figure 2:
Figure 2:
δM2 LFER analysis. Brønsted plots for most of the probed δM2 positions (denoted 1′–19′ from the intracellular to the extracellular end). Wild-type residues are enclosed by a rectangle. Φ-values are given by the slopes of linear fits to the plots. The 11′- and 15′-position data are omitted because, for technical reasons, their Φ-values could not be determined (see text). The Brønsted plot corresponding to the 10′-position is presented in Figure 3, and that corresponding to the 12′-position (17) is shown in Figure 6.
Figure 3:
Figure 3:
δM2 10′ LFER analysis. To account for the curvature of this plot, the data points were fitted with a model of two parallel transition states (curved line) using the equation log β=log[βo1(β/α)Φ1+βo2(β/α)Φ2], where βo1 and βo2 are the diliganded receptor opening rate constants corresponding to the pathways that traverse either transition state when the equilibrium constant (β/α) is unity and Φ1 and Φ2 are the corresponding Φ-values at δM2 10′. Although this model fits the data better than a model of a single transition state (i.e., a fit to a straight line; not shown), the parameter estimates were ill-defined (βo1 = 188 ± 328 s−1; Φ1 = 0 ± 0.5; βo2 = 1835 ± 625 s−1; Φ2 = 2.1 ± 1.3), and the Φ-value of 2.1 is nonsensical in the context of an LFER. The slope of the straight line between the Ala (wild type; enclosed by a rectangle), Cys, Pro, Ser, and Gly constructs was −0.05 (excluding the Gly point from this fit changes this slope to −0.04). As another alternative, the wild-type’s Φ-value at δ10′ was calculated as the first derivative of the curved line at the wild-type β/α value. This calculation yielded a value of 0.16, which does not affect the conclusions of this paper.
Figure 4:
Figure 4:
High-resolution map of Φ-values in δM2. Schematic representation of the AChR subunit topology. The transmitter binding sites (TBS) are ~45 Å away from the middle of the membrane (6, 12, 13). The channel pore is lined, for the most part, by the five M2 segments. Point mutations were engineered at positions indicated in bold. (O) Φ-value range, −0.18 to 0.03; (●) Φ-value range, 0.24 to 0.38. This pattern suggests that, during the opening reaction, the movement of the extracellular half of δM2 (12′ to 19′) precedes that of the intracellular half (2′ to 10′).
Figure 5:
Figure 5:
Effect of the ratio of equilibrium constants on the accuracy of Φ-values calculated from two-point LFERs. The data points corresponding to the wild type and 11 δ12′ mutants (14, 17) were combined in all possible pairs (66 combinations). Φ-values were calculated for each pair using the corresponding rate and equilibrium constants and were plotted as a function of the respective ratios of equilibrium constants. The δ12′ data were used for this analysis because it is the most extensive LFER in our data. The horizontal dashed line is at Φ = 0.275, the slope of the linear fit to the entire data set (17). As expected, the larger the ratio of equilibrium constants, the more accurate the pairwise estimate. The point corresponding to the Tyr-Val pair (Φpairwise = −1.82; equilibrium constant ratio = 1.13) was omitted from the plot to allow a higher magnification scale.
Figure 6:
Figure 6:
Rate equilibrium linear free energy relationships and physical interpretation of fractional Φ-values. The LFER data corresponding to the δ12′ mutant series were fitted with a straight line of slope (Φ) 0.275; this corresponds to a single transition state model (dotted line). The predictions of alternative models, consisting of either two [Φ1 = 0 and Φ2 = 1 (labeled as “a”); Φ1 = 0 and Φ2 = 0.8 (“e”); Φ1 = 0.075 and Φ2 = 0.475 (“d”); Φ1 = 0.175 and Φ2 = 0.375 (“b”)] or 10 parallel transition states [equally spaced Φ-values between 0 and 0.55 (“c”) and between 0.5 and 1 (“f”)] were superimposed on the experimental points. Although the meaning of fractional Φ-values is not unambiguous, some interpretations can be ruled out. The predictions of the different models were calculated as logβ=logi=1kβoi(β/α)Φi, where βoi is the diliganded receptor opening rate constant corresponding to the pathway that traverses transition state i when the equilibrium constant (β/α) is unity, Φi is the corresponding Φ-value, and k is the number of parallel transition states in the model. For the model of two competing transition states of Φ1 = 0 and Φ2 = 1 (“a”), the βoi values were set so that the wild-type channel visits transition state 2 (Φ = 1) 27.5% of the time and transition state 1 (Φ = 0) the remaining 72.5% of the time (the probability of going through one or the other transition state is a function of the equilibrium constant in models with competing mechanisms). For the other models with multiple parallel transition states, the βoi-values were arbitrarily considered to be identical, and equal to βo/k, where βo is the observed opening rate constant (i.e., due to all transition states) when β/α) 1.
Figure 7:
Figure 7:
Φ-Values define two halves of δM2. There is an apparent clustering of Φ-values into two groups delimited by the middle of the δM2 transmembrane segment. The corresponding average Φ-values, indicated with horizontal dotted lines, are −0.07 (2′, 5′, 7′, 9′, and 10′; “the intracellular half”) and 0.32 (12′, 13′, 17′, and 19′; “the extracellular half”). This discontinuity in the Φ-values near the midpoint of this mostly α-helical structure suggests that the rearrangement of the extracellular half precedes that of the intracellular half during opening (and follows during closing). Thus, we infer that the conformational changes associated with gating include the deformation of the backbone structure near the middle of δM2.

References

    1. Imoto K, Methfessel C, Sakmann B, Mishina M, Mori Y, Konno T, Fukuda K, Kurasaki M, Bujo H, and Fujita Y (1986) Nature 324, 670–674. - PubMed
    1. Imoto K, Busch C, Sakmann B, Mishina M, Konno T,Nakai J, Bujo H, Mori Y, Fukuda K, and Numa S (1988) Nature 335, 645–648. - PubMed
    1. White BH, and Cohen JB (1992) J. Biol. Chem 267, 15770–15783. - PubMed
    1. Akabas MH, Kaufmann C, Archdeacon P, and Karlin A (1994) Neuron 13, 919–927. - PubMed
    1. Zhang H, and Karlin A (1998) Biochemistry 37, 7952–7964. - PubMed

Publication types

MeSH terms