. 2002 Apr;14(4):945-62.
doi: 10.1105/tpc.000836.

Rab2 GTPase regulates vesicle trafficking between the endoplasmic reticulum and the Golgi bodies and is important to pollen tube growth

Affiliations

Rab2 GTPase regulates vesicle trafficking between the endoplasmic reticulum and the Golgi bodies and is important to pollen tube growth

Alice Y Cheung et al. Plant Cell. 2002 Apr.

Abstract

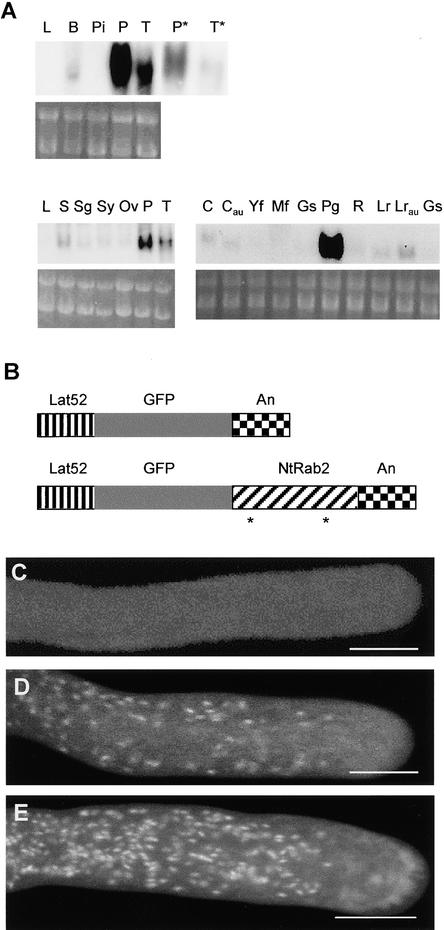
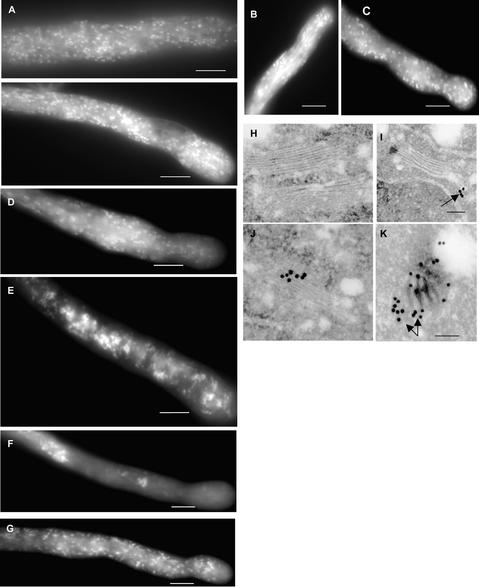
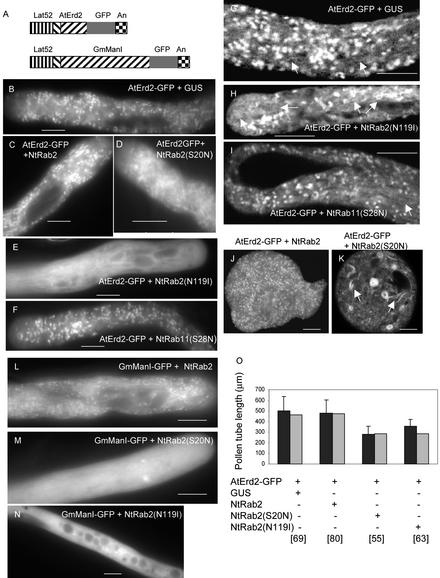
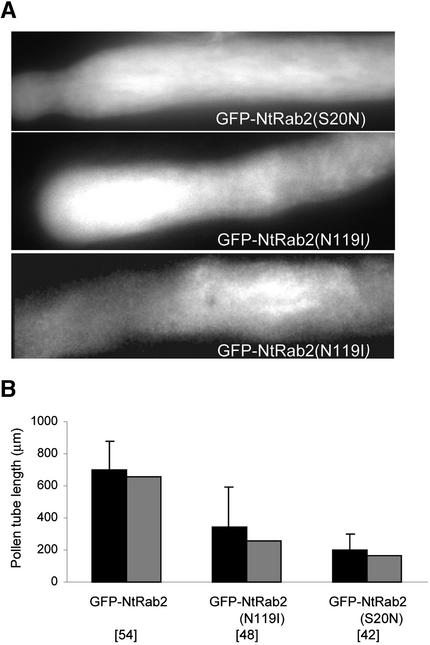
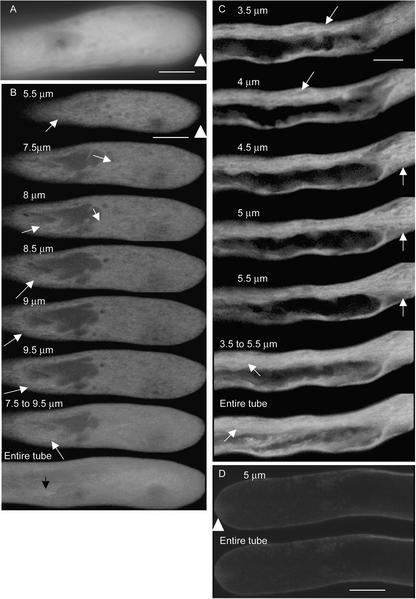
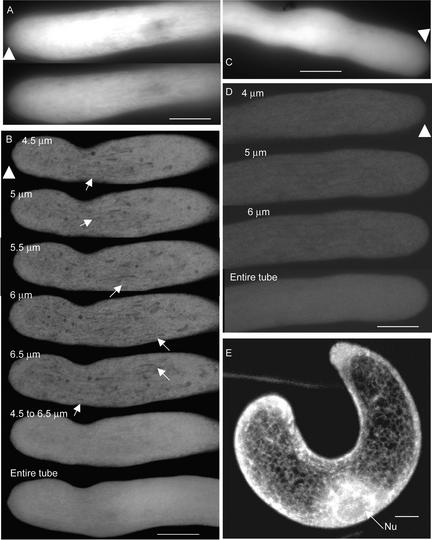
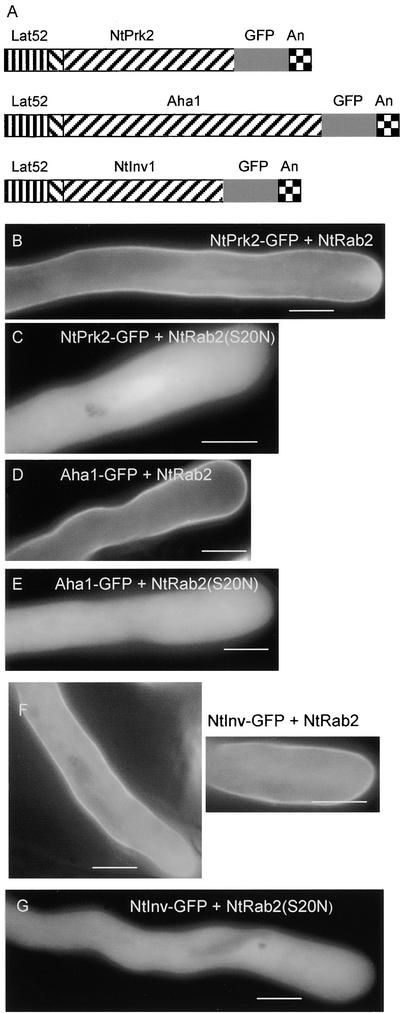
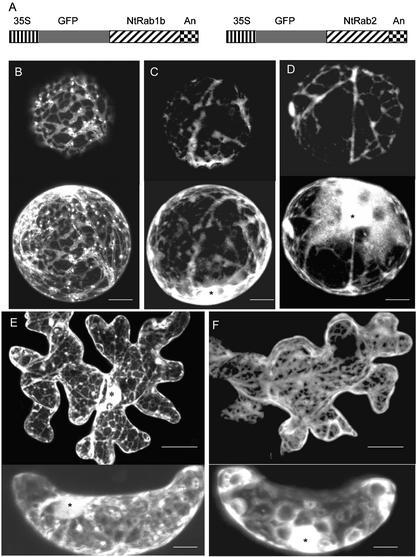
Pollen tube elongation depends on the secretion of large amounts of membrane and cell wall materials at the pollen tube tip to sustain rapid growth. A large family of RAS-related small GTPases, Rabs or Ypts, is known to regulate both anterograde and retrograde trafficking of transport vesicles between different endomembrane compartments and the plasma membrane in mammalian and yeast cells. Studies on the functional roles of analogous plant proteins are emerging. We report here that a tobacco pollen-predominant Rab2, NtRab2, functions in the secretory pathway between the endoplasmic reticulum and the Golgi in elongating pollen tubes. Green fluorescent protein-NtRab2 fusion protein localized to the Golgi bodies in elongating pollen tubes. Dominant-negative mutations in NtRab2 proteins inhibited their Golgi localization, blocked the delivery of Golgi-resident as well as plasmalemma and secreted proteins to their normal locations, and inhibited pollen tube growth. On the other hand, when green fluorescent protein-NtRab2 was over-expressed in transiently transformed leaf protoplasts and epidermal cells, in which NtRab2 mRNA have not been observed to accumulate to detectable levels, these proteins did not target efficiently to Golgi bodies. Together, these observations indicate that NtRab2 is important for trafficking between the endoplasmic reticulum and the Golgi bodies in pollen tubes and may be specialized to optimally support the high secretory demands in these tip growth cells.


Figures

Figure 1.
Figure 1.
RNA Gel Blots Showing Pollen-Predominant Expression of NtRab2 mRNA. (A) Comparable amounts of total RNA (10 μg) were loaded in each lane, as confirmed by ethidium bromide staining (below the autoradiograms). The RNA gel blots were hybridized with 32P-labeled NtRab2 cDNA. Top, L, leaves from 8- to 10-week-old plants grown in vitro; B, young floral buds (<1.5 cm); Pi, developing pistils (stigmas and styles) from 2- to 3-cm floral buds; P, pollen grains; T, 6-hr-old pollen tubes; P* and T*, one-tenth exposure relative to the P and T lanes. Bottom left, S, 11-day-old seedlings grown in vitro; Sg, Sy, and Ov, stigma, style, and ovary tissues, respectively, from mature but unpollinated pistils. (For floral developmental stages, see Kultonow et al. [1990].) Bottom right, C and Cau, cotyledons and emerging true leave of 10-day-old seedlings without or with auxin treatment, respectively, for 2 days before tissue collection; Yf, Mf, and Gs, young fruit, mature fruit, and germinating seed, respectively; Pg, pollen grains; R, roots from 8- to 10-week-old tissue culture–grown plants; Lr and Lrau, 10-day-old liquid root cultures without and with auxin treatment, respectively, for the last 2 days. (B) Fusion gene constructs Lat52-GFP (top) and Lat52-GFP-NtRab2 (bottom). “An” indicates a fragment with the polyadenylation signal from the T-DNA nopaline synthase gene. Asterisks indicate approximate locations for the dominant-negative S20N and N119I mutations. (C) to (E) Confocal images showing the GFP-NtRab2 association with highly motile organelles in elongating pollen tubes. (C) Elongating Lat52-GFP–transformed pollen tube in which the fluorescence signal was observed throughout the cytosol. (D) Single optical section at the median plane of a Lat52-GFP-NtRab2–transformed elongating pollen tube. A time series of this section that shows the motility of the GFP-labeled organelles and pollen tube growth can be viewed in the supplemental data online. These organelles streamed tipward along the cortical region of the tube, reversed direction at the base of the clear zone, and streamed backward in the center of the tube in what is known as a “reverse-fountain” pattern. (E) Projection of 10 optical sections obtained by the fast-scan mode in 1-μm steps through an entire elongating pollen tube expressing GFP-NtRab2. The apical region of the tubes shown in (D) and (E) in which fluorescent organelles were absent is the clear zone. Pollen tubes shown in (D) and (E) were transformed by microprojectile bombardment. Tubes that developed from pollen grains isolated from Lat52-GFP-NtRab2–transformed plants showed GFP labeling patterns indistinguishable from those shown in (D) and (E) (data not shown). Tobacco pollen tubes expressing GFP-AtRab2 also showed labeling patterns indistinguishable from those shown in (D) and (E) (data not shown). Bars = 10 μm.
Figure 2.
Figure 2.
GFP-NtRab2 Is Targeted to Golgi Bodies. (A) Segment of a transformed pollen tube expressing the Golgi marker protein ManI-GFP (top) and another tube expressing AtErd2-GFP (bottom). Both pollen tubes were transformed by microprojectile bombardment. (B) and (C) Five-second exposures of a pollen tube expressing NtRab2-GFP (B) and of a similar tube that had been treated with 3.9 μM cytochalasin D for 5 min (C). The arrest of organelle motility by the actin filament–disrupting drug is reflected by the discrete organelles shown in (C) relative to the extensive tailing observed in (B), which reflects the motility of the fluorescent organelles. (D) to (G) GFP-NtRab2–labeled organelles in transformed pollen tubes are dissociated by BFA treatment. Elongating Lat52-GFP-NtRab2–transformed pollen tubes were treated with 1 μg/mL BFA for 1, 5, and 10 min in (D), (E), and (F), respectively, before imaging. (G) shows a similar pollen tube after a 20-min treatment with BFA and a 15-min incubation in BFA-free medium, demonstrating recovery of the GFP-labeled structures from the BFA treatment. Normal growth resumed in these tubes (data not shown) and was reflected in part by the reappearance of the clear zone at the tube apex. (H) to (K) Cytoimmunodetection localized GFP-NtRab2 to the Golgi stacks. Immunogold labeling of ultrathin sections prepared from in vitro–grown nontransformed (H) or Lat52-GFP-NtRab2–transformed ([I] to [K]) pollen tubes. Tissue sections were reacted with primary antibodies against GFP and then with colloidal gold–labeled secondary antibodies. Arrows point to the periphery regions of Golgi stacks. (A) to (G) show fluorescence micrographs, and (H) to (K) show transmission electron micrographs. Samples shown in (B) to (K) were from pollen tubes developed from grains isolated from Lat52-GFP-NtRab2–transformed plants. Observations indistinguishable from those shown here also were been made with transformed tobacco pollen tubes expressing GFP-AtRab2 (data not shown). Bars in (A) to (G) = 10 μm; bars in (I) and (K) = 60 nm for (H) to (K).
Figure 4.
Figure 4.
Localization of AtErd2-GFP and GmManI-GFP to Golgi Bodies Is Inhibited by the Coexpression of Dominant-Negative NtRab2(S20N) or NtRab2(N119I). (A) Fusion gene constructs Lat52-AtErd2-GFP (top) and Lat52-GmManI-GFP (bottom) for Golgi marker proteins. The diagonally striped region indicates the signal peptide for each of the proteins. “An” indicates the polyadenylation signal. (B) to (E) Pollen tubes from cultures that provided the growth comparison data shown in (O). (G) to (K) Projections of three optical sections at 1-μm steps near the median region of the pollen tubes or grains. Arrows in (G) to (I) and (K) point to ER membrane fragments. Pollen tubes shown in the light micrographs in (B) to (F) and (L) to (N) were from 6-hr growth cultures; those shown in the confocal micrographs in (G) to (I) were from 15-hr cultures when growth and cytoplasmic streaming had slowed. The transgenic proteins expressed by these pollen tubes are indicated in each micrograph. The marker proteins were tagged with GFP; the various forms of Rab2 proteins were not tagged. (B) to (F) and (L) to (N) show fluorescence micrographs; and (G) to (K) show confocal images. Cotransformation with Lat52-GUS or Lat52-NtRab2 ([B], [C], [G], [J], and [O]) served as a control to ensure that the amounts of DNA introduced into the transformed pollen tubes did not affect pollen tube growth and marker protein localization in these comparative studies. Bars = 10 μm. (O) Length comparison of microprojectile-transformed pollen tubes expressing the proteins indicated after 6 hr of growth. Black bars indicate average length, and gray bars indicate median length. In all of the pollen tubes used, 5 μg of the marker gene LAT52-AtErd2-GFP DNA and 15 μg of the other non-GFP–tagged chimeric DNA were used for transformation. Transgenic proteins expressed by each transformed class of pollen tubes are indicated at the bottom of the histograms. The number in brackets below each histogram indicates the number of tubes scored in the experiment shown. Data shown are from one of three replicated experiments that gave qualitatively similar results.
Figure 3.
Figure 3.
Dominant-Negative Mutants of NtRab2 Do Not Target Golgi Bodies and Inhibit Pollen Tube Elongation. (A) Fluorescence images (top and middle) taken from cultures with dominant-negative GFP-NtRab2–expressing tubes that provided the data shown in (B), and confocal image (bottom; a projection of three optical sections at 1-μm steps in the median region) of a pollen tube expressing GFP-NtRab2(N119I). Similar confocal images also were observed for pollen tubes expressing GFP-NtRab2(S20N) (data not shown). Pollen tubes shown here were transformed by microprojectile bombardment. The transgenic proteins expressed in these transformed pollen tubes are indicated. (B) Length comparison of pollen tubes transformed by Lat52-GFP-NtRab2, Lat52-GFP-NtRab2(S20N), or Lat52-GFP-NtRab2(N119N) (10 μg of each) after 6 hr of growth. Average (black bars) and median (gray bars) tube lengths are shown. The number in brackets below each histogram indicates the number of tubes scored for the experiment shown. The median tube length in pollen tube cultures more closely reflects the visual observation that most of the GFP-NtRab2(S20N)– and GFP-NtRab2(N119I)–expressing tubes extended considerably shorter distances than GFP-NtRab2–expressing control tubes. Data shown are from one of three replicated experiments that gave qualitatively similar results. Pollen tubes cotransformed by Lat52-GFP and unlabeled Lat52-NtRab2, Lat52-NtRab2(S20N), or Lat52-NtRab2(N119I) gave qualitatively similar results as those shown in (B).
Figure 6.
Figure 6.
Dominant-Negative NtRab2 Induced the Retention of Cell Membrane–Associated Marker Proteins in the ER. (A) Fluorescence micrograph of an NtPrk2-GFP– and NtRab2(S20N)-coexpressing pollen tube showing a GFP labeling pattern suggestive of extensive internal membrane structure. (Compare with Figures 6A and 7C.) (B) Top six images show single optical sections taken at 0.5-μm intervals of the tip region of an NtPrk2-GFP– and NtRab2(S20N)-coexpressing transformed pollen tube similar to that shown in (A). The seventh image shows a projection of the second to the sixth consecutive images. The bottom image shows a projection of 0.5-μm sections across the entire pollen tube. (C) Top five images show single optical sections taken at 0.5-μm intervals of the shank region, where large vacuoles began to accumulate, of an Aha1-GFP– and NtRab2(S20N)-coexpressing transformed pollen tube. The bottom two images show projections of the top five images and of images taken across the entire tube, respectively. (D) Top image shows a single optical section at the tip region of an NtPrk2-GFP–expressing control transformed pollen tube showing a predominant cell membrane association for this fusion protein; bottom image shows a projection of all images across the entire tube. All pollen tubes were from 15-hr-old cultures. The numbers at the top left corner of each image represent the distance from the bottom of the tube. All pollen tubes shown were transformed by microprojectile bombardment. Triangles indicate the pollen tube tips. Arrows point to the more prominent ER membrane fragments. Bars = 10 μm.
Figure 7.
Figure 7.
Imaging of the Pollen Tube ER Network Using an ER-Targeted YFP. (A) Fluorescence micrographs of a pollen tube expressing the ER-targeted YFP. Top and bottom images show a longer and a shorter exposure, respectively, of the same tube to demonstrate a labeling pattern that was not as smooth as that shown by transformed pollen tubes expressing GFP alone (as shown in [C]). (B) Top five images show consecutive optical sections taken at 0.5-μm steps and demonstrate a dense network of ER tubules in the tip region of an ER-targeted YFP-expressing transformed tube (as shown in [A]). Bottom two images show projections of the top five optical sections and of the entire tube, respectively. Arrows point to the more prominent tubular structures, which are blurred when multiple images are projected together. (C) Fluorescence micrograph of a GFP-expressing transformed pollen tube. (D) Top three images show single optical sections of a GFP-expressing pollen tube. Bottom image shows a projection of sections across the entire tube. (E) Microprojectile bombardment–transformed guard cell expressing the same ER-targeted YFP from a CaMV 35S promoter. The labeled ER network confirmed proper ER targeting of the fusion protein used. All pollen tubes shown were transformed by microprojectile bombardment. Triangles point to the pollen tube tips. Nu, nucleus. Bars = 10 μm.
Figure 5.
Figure 5.
Dominant-Negative NtRab2s Inhibit the Transport of Pollen Tube Cell Membrane and Secreted Proteins. (A) Fusion gene constructs Lat52-NtPrk2-GFP (top), Lat52-Aha1-GFP (middle) for cell membrane–associated marker proteins, and Lat52-NtInv-GFP (bottom) for a cell wall marker protein. The diagonally striped region indicates the signal peptide for each protein. “An” indicates the polyadenylation signal. (B) to (G) Fluorescence micrographs of 6-hr-old pollen tubes. Transgenic proteins expressed by the pollen tubes are indicated; the cargo marker proteins were tagged with GFP, but the various forms of Rab2 proteins were not tagged. (F) shows the shank (left) and the tip (right) regions of two different pollen tubes expressing the same cargo protein, NtInv-GFP. The effect of NtRab2(N119I) was similar to that of the S20N mutant (data not shown). The highly fluorescent reverse conical region at the apex of the tube shown in (B) reflects the region packed with secretory vesicles in elongating pollen tubes. Bars = 10 μm.
Figure 8.
Figure 8.
CaMV35S-Expressed GFP-NtRab2 Does Not Target Efficiently to Golgi Bodies of Leaf Cells. (A) Fusion gene constructs 35S-GFP-NtRab1b (left) and 35S-GFP-NtRab2 (right). “An” indicates the polyadenylation signal. (B) Transiently transformed protoplast expressing GFP-NtRab1b. (C) and (D) Transiently transformed protoplasts expressing GFP-NtRab2. Top and bottom images in (B) to (D) are from the same protoplast. Top images show projections of four 1-μm sections close to the cortical region of the protoplast. Bottom images show projections of 1-μm sections across the entire protoplast. (E) Microprojectile bombardment–transformed epidermal cell (top) and guard cell (bottom) expressing GFP-NtRab1b. Transient expression of GFP-AtRab1b in similarly transformed leaf protoplasts and epidermal cells showed patterns indistinguishable from those shown in (B) and (E) (data not shown). (F) Microprojectile bombardment–transformed epidermal cell (top) and guard cell (bottom) expressing GFP-NtRab2. Top and bottom images in (E) and bottom image in (F) show projections of 1-μm optical sections across the entire cell; top image in (F) shows a projection of 1-μm sections across half of the cell. Asterisks indicates the nucleus as visualized by differential interference contrast imaging. Bars in (B) to (D) and the bottom images in (E) and (F) = 10 μm; bars in the top images in (E) and (F) = 50 μm.

References

    1. Allan, B.B., Moyer, B.D., and Balch, W.E. (2000). Rab1 recruitment of p115 into a cis-SNARE complex: Programming budding COPII vesicles for fusion. Science 289, 444–447. - PubMed
    1. Alory, C., and Balch, W.E. (2000). Molecular basis for Rab prenylation. J. Cell Biol. 150, 89–103. - PMC - PubMed
    1. Andreeva, A.V., Zheng, H., Saint-Jore, C.M., Kutuzov, M.A., Evans, D.E., and Hawes, C.R. (2000). Organization of transport from endoplasmic reticulum to Golgi in higher plants. Biochem. Soc. Trans. 28, 505–512. - PubMed
    1. Arabidopsis Genome Initiative. (2000). Analysis of the genome sequence of the flowering plant Arabidopsis thaliana. Nature 408, 796–815. - PubMed
    1. Ayala, J., Olofsson, B., Touchot, N., Zahraoui, A., Tavitian, A., and Prochiantz, A. (1989). Developmental and regional expression of three new members of the ras-gene family in the mouse brain. J. Neurosci. Res. 22, 384–389. - PubMed

Publication types

MeSH terms

Substances

LinkOut - more resources