. 2002 May 1;124(17):4857-64.
doi: 10.1021/ja012666e.

Time-resolved resonance Raman analysis of chromophore structural changes in the formation and decay of rhodopsin's BSI intermediate

Affiliations

Time-resolved resonance Raman analysis of chromophore structural changes in the formation and decay of rhodopsin's BSI intermediate

Duohai Pan et al. J Am Chem Soc. .

Abstract

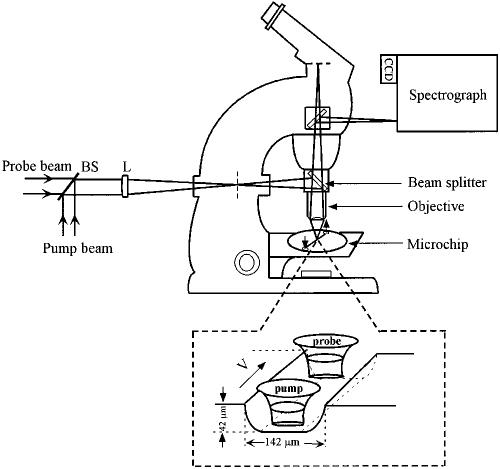
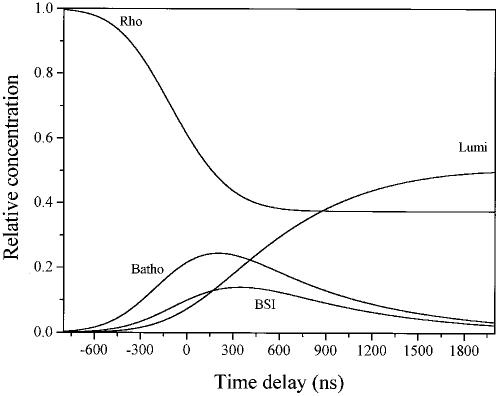
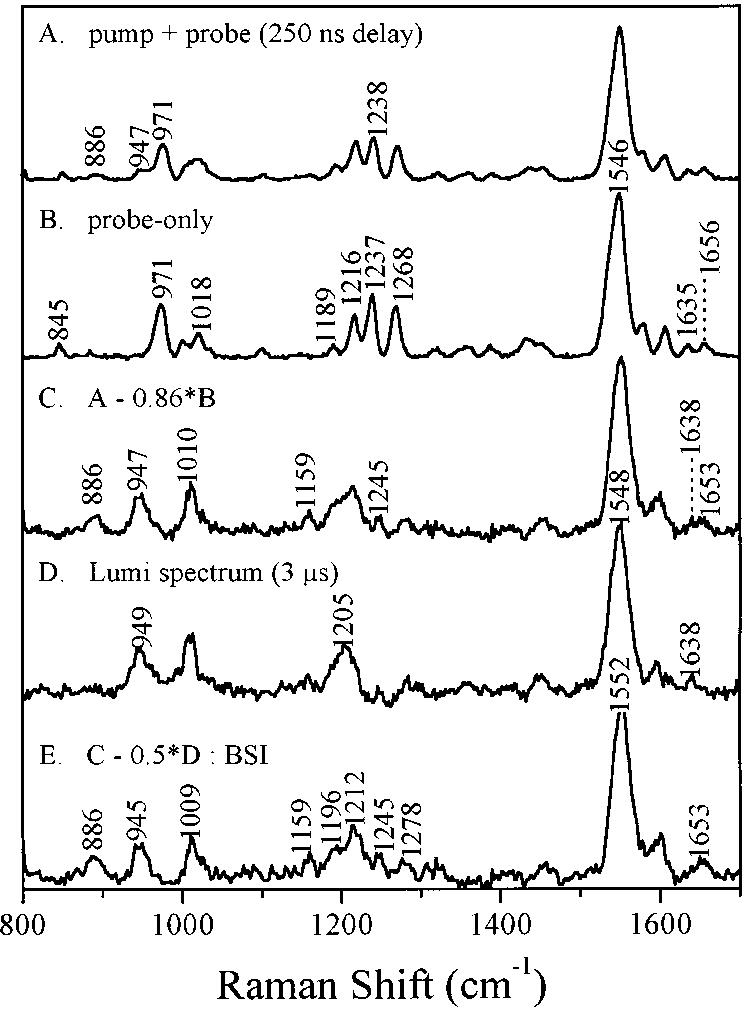
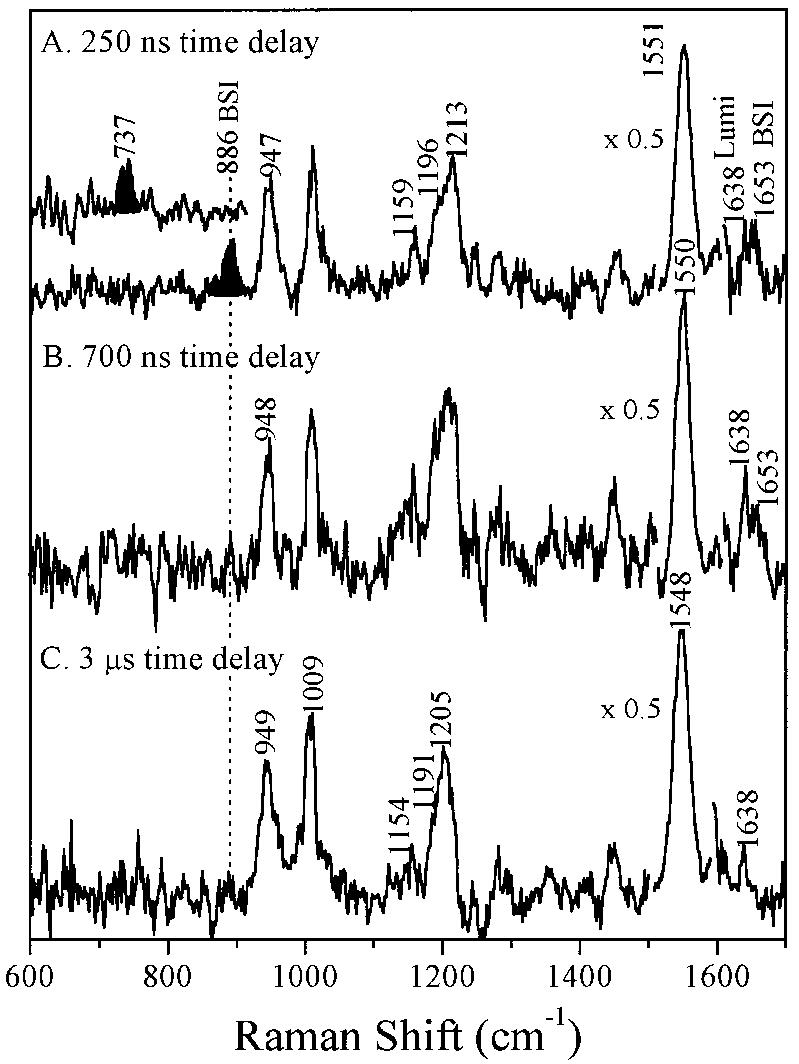
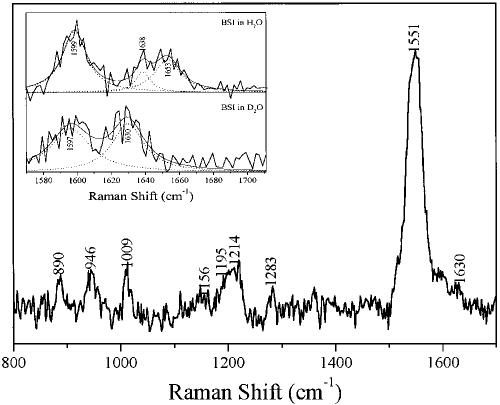
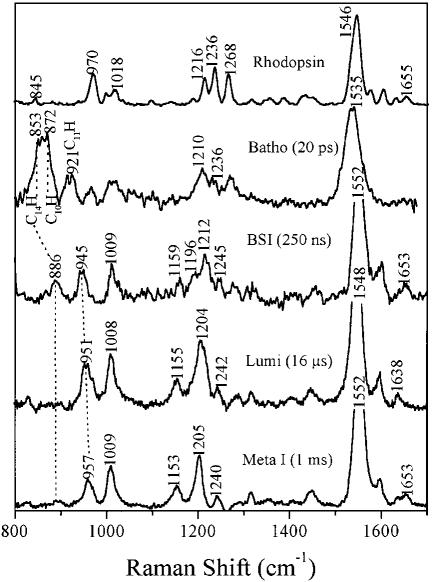
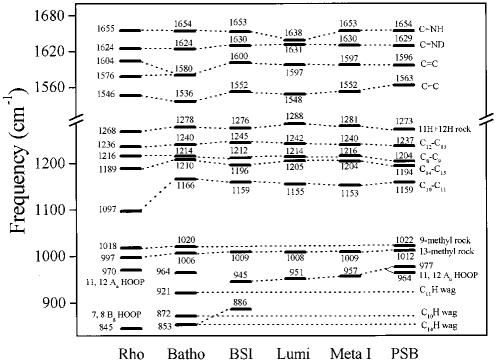
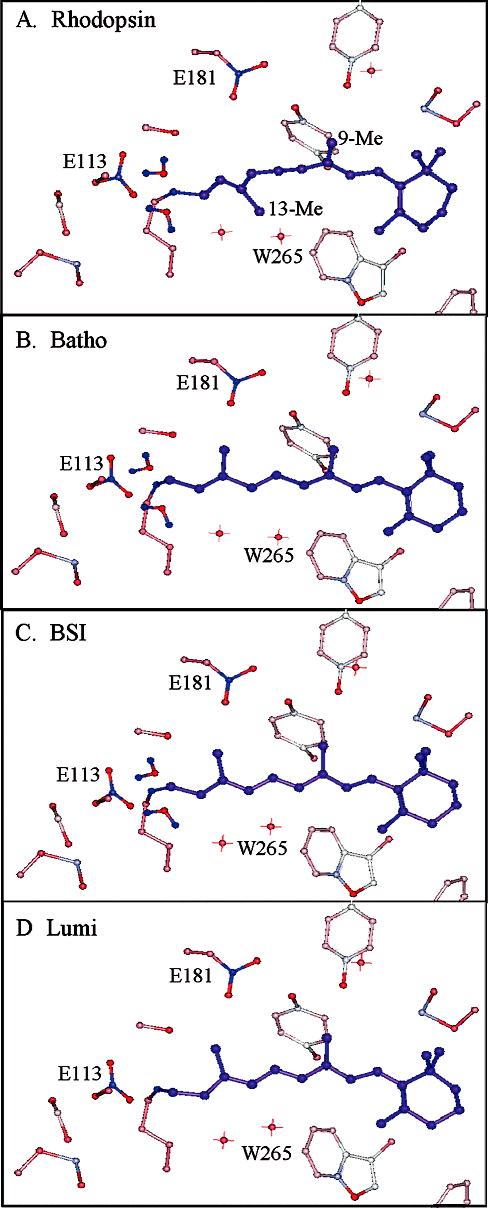
Time-resolved resonance Raman microchip flow experiments are performed to obtain the vibrational spectrum of the chromophore in rhodopsin's BSI intermediate and to probe structural changes in the bathorhodopsin-to-BSI and BSI-to-lumirhodopsin transitions. Kinetic Raman spectra from 250 ns to 3 micros identify the key vibrational features of BSI. BSI exhibits relatively intense HOOP modes at 886 and 945 cm(-1) that are assigned to C(14)H and C(11)H=C(12)H A(u) wags, respectively. This result suggests that in the bathorhodopsin-to-BSI transition the highly strained all-trans chromophore has relaxed in the C(10)-C(11)=C(12)-C(13) region, but is still distorted near C(14). The low frequency of the 11,12 A(u) HOOP mode in BSI compared with that of lumirhodopsin and metarhodopsin I indicates weaker coupling between the 11H and 12H wags due to residual distortion of the BSI chromophore near C(11)=C(12). The C=NH(+) stretching mode in BSI at 1653 cm(-1) exhibits a normal deuteriation induced downshift of 23 cm(-1), implying that there is no significant structural rearrangement of the Schiff base counterion region in the transition of bathorhodopsin to BSI. However, a dramatic Schiff base environment change occurs in the BSI-to-lumirhodopsin transition, because the 1638 cm(-1) C=NH(+) stretching mode in lumirhodopsin is unusually low and shifts only 7 cm(-1) in D(2)O, suggesting that it has essentially no H-bonding acceptor. With these data we can for the first time compare and discuss the room temperature resonance Raman vibrational structure of all the key intermediates in visual excitation.


Figures

Figure 1.
Figure 1.
Time-resolved resonance Raman microchip flow apparatus. The two cylindrically focused laser beams (3 × 100 μm) are displaced along the flow direction to establish the time resolution. To obtain a resonance Raman spectrum of BSI, the two laser beams were separated by ∼0.7 μm and a flow rate of 280 cm/s gave a pump-probe time delay of ∼ 250 ns. The expanded chip view shows just the bottom etched wafer that makes up the bonded 2-layer glass sandwich structure. The beam paths indicated are not drawn to scale.
Figure 2.
Figure 2.
Temporal evolution of the relative concentrations of Rho, Batho, BSI, and Lumi, where k1f = k1r= 4.44 × 10⁶ s-1, k2= 3.4 × 10⁶ s-1, and k3= 1.0 × 10⁵ s-1 at 5 °C (ref 15). The photoisomerization rate was given by k= 1.31 × 10⁵ exp(-6.6t2), which describes the time-dependent photoisomerization of rhodopsin in a volume element of the sample as it passes through the Gaussian profile laser beam (ref 24). The 531 nm light intensity at the 3 × 100 μm beam waist is 2.2 × 10²¹ photons cm-2 s-1. The flow rate and transit time are 280 cm/s and 1.1 μs, respectively.
Figure 3.
Figure 3.
Raman microchip flow spectra of rhodopsin's BSI intermediate: (A) pump-plus-probe spectrum, (B) probe-only spectrum, (C) transient spectrum obtained by subtracting 86% of the probe-only spectrum from the pump-plus-probe spectrum, (D) the Lumi spectrum with a 3 μs time delay, and (E) the BSI spectrum obtained by subtracting the indicated fraction of the Lumi spectrum from the transient spectrum. The optimum subtraction coefficient was determined to be 0.5 ± 8%. The pump wavelength was 531 nm (2.5 mW) and the probe was 458 nm (450 μW). The 250 ns time delay was provided by a 280 cm/s flow rate and the 0.7 μm displacement between the 3 × 100 μm pump and probe beams.
Figure 4.
Figure 4.
Kinetic Raman spectra of the BSI and Lumi intermediates at the indicated time delays (7 °C). All spectra were obtained by subtracting the optimized fraction of the probe-only spectrum from the corresponding pump-plus-probe spectrum. The insert in spectrum A presents the 600-900 cm-1 region of the Raman spectrum of the 14D derivative of BSI at 250 ns time delay. The 700 ns time delay was provided by a separation of 2 μm and a flow speed of 260 cm/s. The 3 μs time delay was provided by a separation of 8 μm and a 250 cm/s flow speed. The pump and probe excitation wavelengths were 531 and 458 nm, respectively.
Figure 5.
Figure 5.
Transient resonance Raman spectrum of BSI with a 250 ns time delay in D2O buffer. The insert compares the Schiff base region of the Raman spectra of BSI in H2O and D2O.
Figure 6.
Figure 6.
Room-temperature time-resolved resonance Raman spectra of rhodopsin and its intermediates. The rhodopsin spectrum was obtained with 458 nm excitation. The Batho spectrum with 20 ps time delay at room temperature is reproduced with permision from Kim et al. (ref 6). The Lumi and Meta I spectra are from our previous study (ref 20).
Figure 7.
Figure 7.
Correlation diagram of the HOOP, fingerprint, ethylenic, and Schiff base mode frequencies observed in rhodopsin, bathorhodopsin, lumirhodopsin, metarhodopsin I, and the all-trans retinal protonated Schiff base (PSB). The frequencies of the all-trans PSB were obtained from spectra in methanol solution (ref 37), which provide a common reference for the protein binding pocket induced effect.
Figure 8.
Figure 8.
Graphics model of the retinal binding site in rhodopsin illustrating the structural changes in the primary photoactivation. (A) The 11-cisrhodopsin structure: The C12-C13 twist angle of -140° dictates that the 13-Me group extends out of the page. The distance of the PSB proton to the carbon atom of E113 is 4.3 Å (ref 28). (B) Batho structure: The twist angles of C10-C11and C12-C13 are -20°, and the twist angle of C14-C15is -56°. The carbon atom of E113 is located 4.3 Å away from the PSB proton. (C) BSI structure: The twist angles of C10-C11, C12-C13, and C14-C15 are -9°, -10°, and -46°, respectively. (D) Lumi structure: The twist angles of C10-C11, C12-C13, and C14-C15 are -4°, -2°, and -9°, respectively. The distances of the PSB proton to the carbon atom of E113 in BSI and Lumi are 3.8 and 4.0 Å, respectively.

References

    1. Mathies RA, Lugtenburg J. Handbook of Biological Physics. In: Stavenga DG, deGrip WJ, Pugh EN Jr., editors. Vol. 3. Elsevier Science Press; Amsterdam, The Netherlands: 2000. pp. 55–90.
    1. Schoenlein RW, Peteanu LA, Mathies RA, Shank CV. Science. 1991;254:412–415. - PubMed
    1. Peteanu LA, Schoenlein RW, Wang Q, Mathies RA, Shank CV. Proc. Natl. Acad. Sci. U.S.A. 1993;90:11762–11766. - PMC - PubMed
    1. Kim JE, Tauber MJ, Mathies RA. Biochemistry. 2001;40:13774–13778. - PMC - PubMed
    1. Kandori H, Shichida Y, Yoshizawa T. Biophys. J. 1989;56:453–457. - PMC - PubMed

Publication types