. 2002 May;22(10):3345-57.
doi: 10.1128/MCB.22.10.3345-3357.2002.

mRTVP-1, a novel p53 target gene with proapoptotic activities

Affiliations

mRTVP-1, a novel p53 target gene with proapoptotic activities

Chengzhen Ren et al. Mol Cell Biol. 2002 May.

Abstract

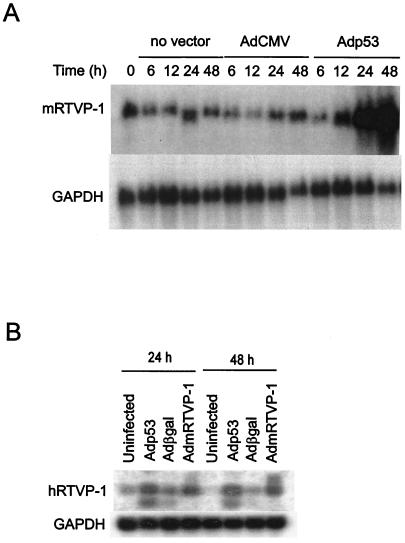
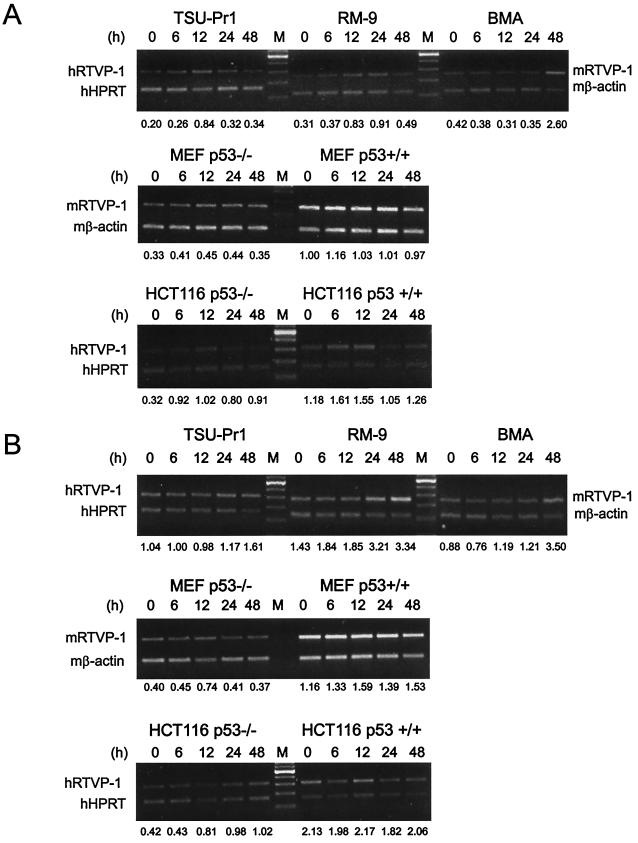
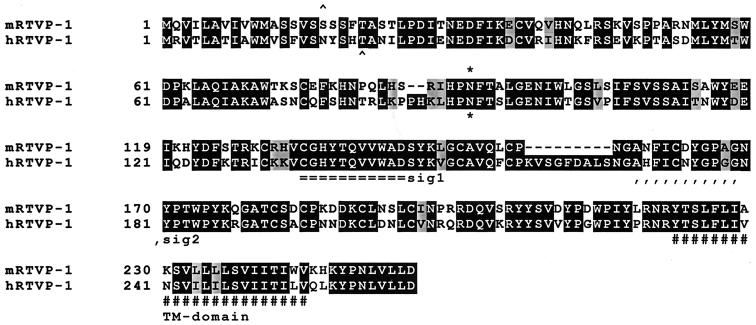
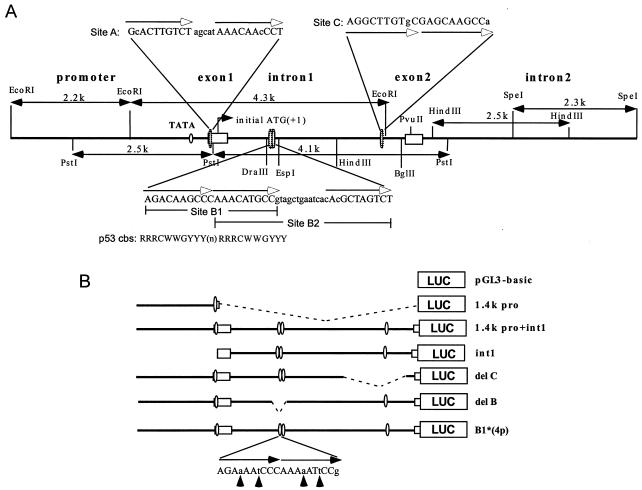
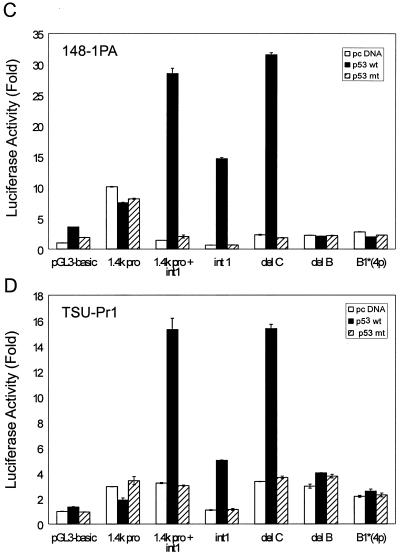
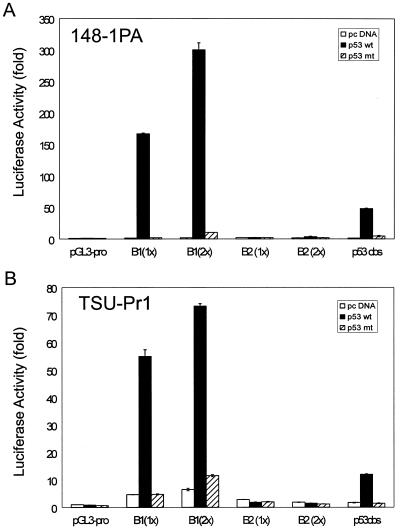
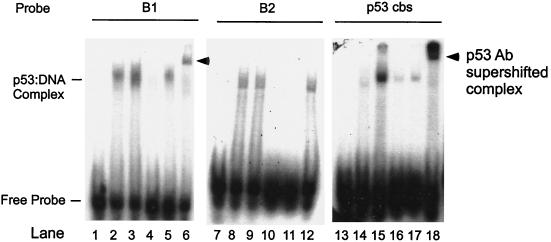
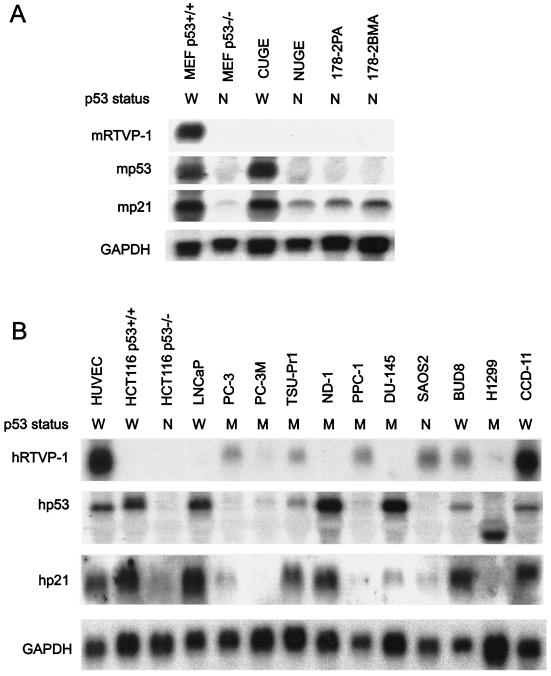
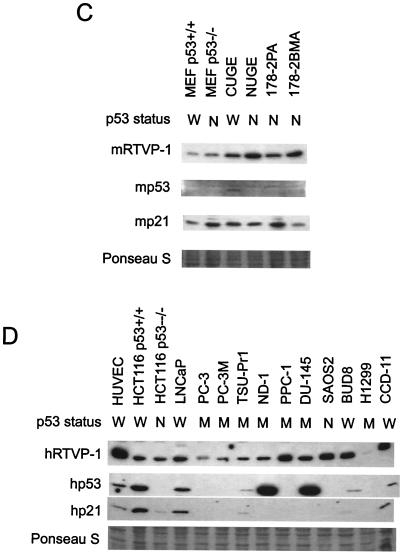
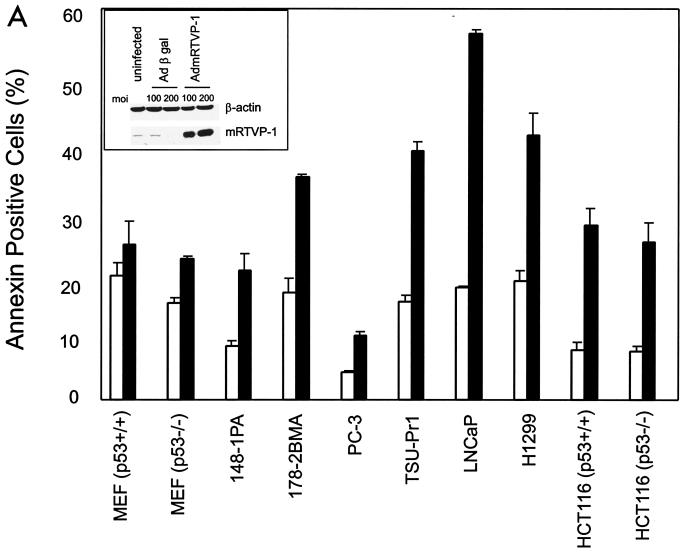
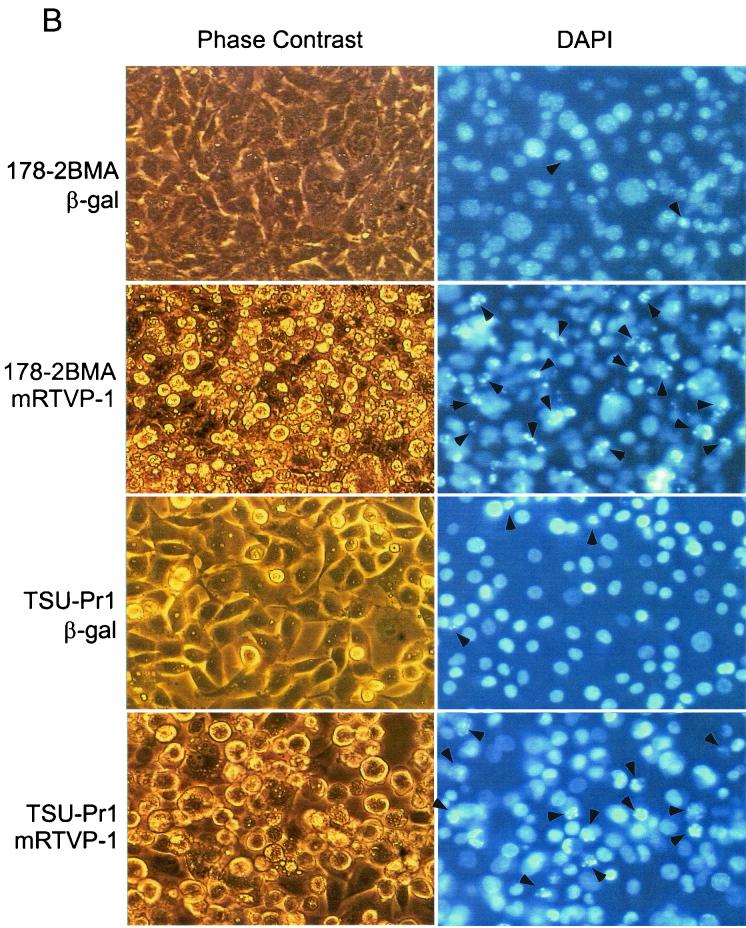
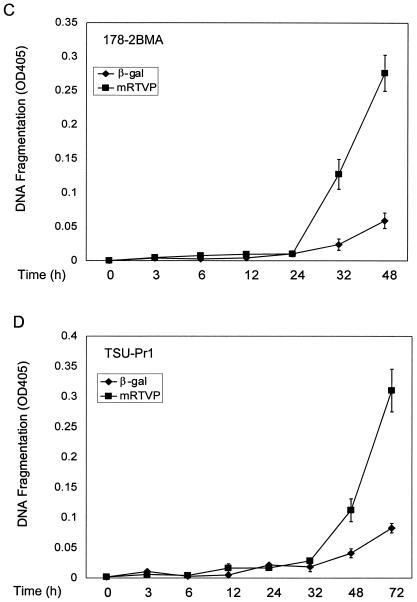
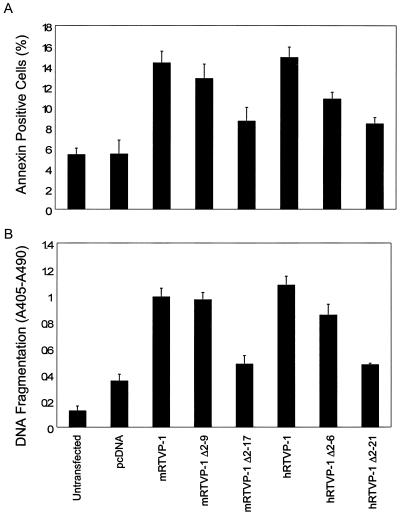
We identified a novel mouse gene, mRTVP-1, as a p53 target gene using differential display PCR and extensive promoter analysis. The mRTVP-1 protein has 255 amino acids and differs from the human RTVP-1 (hRTVP-1) protein by two short in-frame deletions of two and nine amino acids. RTVP-1 mRNA was induced in multiple cancer cell lines by adenovirus-mediated delivery of p53 and by gamma irradiation or doxorubicin both in the presence and in the absence of endogenous p53. Analysis of RTVP-1 expression in nontransformed and transformed cells further supported p53-independent gene regulation. Using luciferase reporter and electrophoretic mobility shift assays we identified a p53 binding site within intron 1 of the mRTVP-1 gene. Overexpression of mRTVP-1 or hRTVP-1 induced apoptosis in multiple cancer cell lines including prostate cancer cell lines 148-1PA, 178-2BMA, PC-3, TSU-Pr1, and LNCaP, a human lung cancer cell line, H1299, and two isogenic human colon cancer cell lines, HCT116 p53(+/+) and HCT116 p53(-/-), as demonstrated by annexin V positivity, phase-contrast microscopy, and in selected cases 4',6'-diamidino-2-phenylindole staining and DNA fragmentation. Deletion of the signal peptide from the N terminus of RTVP-1 reduced its apoptotic activities, suggesting that a secreted and soluble form of RTVP-1 may mediate, in part, its proapoptotic activities.


Figures

FIG. 1.
FIG. 1.
RTVP-1 is upregulated by p53. (A) Kinetic analysis of mRTVP-1 mRNA expression following infection of the p53-null mouse prostate cancer cell line 148-1 PA with no adenoviral vector, control adenoviral vector (AdCMV), or p53-expressing vector Adp53. (B) Induction of RTVP-1 at 24 and 48 h by Adp53 in the human prostate cancer cell line TSU-Pr1 relative to uninfected, control vector Adβgal, or AdmRTVP-1.
FIG. 2.
FIG. 2.
Time course of RTVP-1 upregulation by gamma irradiation and Dox. (A). Induction of RTVP-1 by gamma irradiation in p53 wild-type mouse prostate cancer cell line RM9, p53 mutant human prostate cancer cell line TSU-Pr1, and p53-null mouse prostate cancer cell line 178-2 BMA (upper panel); isogenic pairs of mouse embryo fibroblast cell lines (MEF p53+/+ and MEF p53−/−) (middle panel); and isogenic human colon cancer cell lines (HCT116 p53+/+ and HCT116 p53−/−) (lower panel). (B) Induction of RTVP-1 by Dox in the same cells as for panel A. The numbers at the bottom of gels are the ratios of hRTVP-1 to human HPRT or mRTVP-1 to mouse β-actin.
FIG. 3.
FIG. 3.
Comparison of deduced protein sequences for mouse and human RTVP-1. Identical amino acids are enclosed in dark boxes, conserved amino acid substitutions are lightly shaded, and gaps in the alignment are indicated by a dash. A potential N glycosylation site is indicated by an asterisk. The putative signal sequence precedes a cleavage site indicated by the symbol ∧. Two conserved regions known as extracellular protein signature motifs 1 and 2 (sig1 and sig2) and a transmembrane domain (TM) are indicated. The human RTVP-1 nucleotide and deduced protein sequences have been previously reported (32).
FIG. 4.
FIG. 4.
Schematic of genomic organization of mRTVP-1 and identification of p53 binding sites. (A) mRTVP-1 genomic sequence identified in clone 163K10 of the mouse RPCI-21 PAC library (26). The four potential p53 binding sites are located in exon 1 (site A) and intron 1 (sites B1, B2, and C). The p53 consensus binding site (cbs) (8) is shown under the B1 site sequence. (B) Schematic of luciferase reporter constructs as detailed in Materials and Methods. In B1*(4p), the C and G in the core sequence of both half-sites were converted to a and t as indicated by arrows. Luciferase activities with 148-1 PA (C) and TSU-Pr1 (D) were determined 24 h after transfection of mRTVP-1-luciferase reporter constructs along with a plasmid expressing wild-type p53 (2) (solid boxes), mutant p53 (2) (hatched boxes), or a control plasmid (pcDNA) (open boxes), as well as pCMVβ-gal for standardization. Luciferase activities were expressed as fold of the activity in the cells transfected by pGL3-basic and pcDNA. Error bars represent standard deviations.
FIG. 4.
FIG. 4.
Schematic of genomic organization of mRTVP-1 and identification of p53 binding sites. (A) mRTVP-1 genomic sequence identified in clone 163K10 of the mouse RPCI-21 PAC library (26). The four potential p53 binding sites are located in exon 1 (site A) and intron 1 (sites B1, B2, and C). The p53 consensus binding site (cbs) (8) is shown under the B1 site sequence. (B) Schematic of luciferase reporter constructs as detailed in Materials and Methods. In B1*(4p), the C and G in the core sequence of both half-sites were converted to a and t as indicated by arrows. Luciferase activities with 148-1 PA (C) and TSU-Pr1 (D) were determined 24 h after transfection of mRTVP-1-luciferase reporter constructs along with a plasmid expressing wild-type p53 (2) (solid boxes), mutant p53 (2) (hatched boxes), or a control plasmid (pcDNA) (open boxes), as well as pCMVβ-gal for standardization. Luciferase activities were expressed as fold of the activity in the cells transfected by pGL3-basic and pcDNA. Error bars represent standard deviations.
FIG. 5.
FIG. 5.
Verification of p53 binding function of B1 and B2 sites by luciferase reporter constructs containing either 1x or 2x copies of B1 or B2 sequence in pGL3-promoter as described in Materials and Methods. Luciferase activities in 148-1PA (A) and TSU-Pr1 (B) were determined as described above and in Materials and Methods. Symbols are as defined for Fig. 4.
FIG. 6.
FIG. 6.
Demonstration of p53 binding to site B1 by EMSA. Nuclear extracts from 148-1 PA cells (p53 null) transfected with pCMVp53 or pCMVβgal were incubated with γ-32P-labeled oligonucleotide probes B1, B2, or p53cbs. Lanes 1, 7, and 13, free probe; lanes 2, 8, and 14, pCMV-βgal-transfected nuclear extract; lanes 3 to 6, 9 to 12, and 15 to 18, pCMV-p53-transfected nuclear extract. Lanes 4 and 16, competition with cold B1 probe; lane 10, competition with cold B2 probe; lanes 5, 11, and 17, competition with p53 cbs probe; lanes 6, 12, and 18, supershift with p53 specific antibody DO1.
FIG. 7.
FIG. 7.
RTVP-1 expression in mouse and human cell lines. Northern blot analysis of mouse (A) and human (B) cell lines. Cells were grown, RNA was isolated, and Northern blotting was performed as described in Materials and Methods. GAPDH was monitored as a loading control. Western blot analysis of mouse (C) and human (D) cell lines. The same membranes used for Western blotting were prestained with Ponseau S, and a portion of each membrane was included at the bottom of each panel as loading control. p53 status is indicated as follows: W, wild type (+/+); M, mutant; and N, null (−/−).
FIG. 7.
FIG. 7.
RTVP-1 expression in mouse and human cell lines. Northern blot analysis of mouse (A) and human (B) cell lines. Cells were grown, RNA was isolated, and Northern blotting was performed as described in Materials and Methods. GAPDH was monitored as a loading control. Western blot analysis of mouse (C) and human (D) cell lines. The same membranes used for Western blotting were prestained with Ponseau S, and a portion of each membrane was included at the bottom of each panel as loading control. p53 status is indicated as follows: W, wild type (+/+); M, mutant; and N, null (−/−).
FIG. 8.
FIG. 8.
Overexpression of mRTVP-1 induces apoptosis. (A) Apoptosis was determined by annexin V binding and flow cytometry on cells infected with Adβgal (open boxes) or AdmRTVP-1 (closed boxes) at a multiplicity of infection of 100. Protein levels of mRTVP-1 in TSU-Pr1 cells were determined by Western blotting (inset) using an affinity-purified antibody to mRTVP-1. The levels of β-actin were also monitored as a loading control. (B) Morphological changes documented by phase-contrast microscopy (left panels) and fluorescence microscopy after DAPI staining (right panels). Arrows indicate apoptotic nuclei. 178-2 BMA images were taken 48 h postinfection; TSU-Pr1 images were taken 72 h postinfection. (C and D) Time courses of DNA fragmentation in 178-2 BMA (C) and TSU-Pr1 (D) after infection by Adβgal or AdmRTVP-1. DNA fragmentation was analyzed at indicated time points by using a Cell Death ELISA kit (Boehringer Mannheim).
FIG. 8.
FIG. 8.
Overexpression of mRTVP-1 induces apoptosis. (A) Apoptosis was determined by annexin V binding and flow cytometry on cells infected with Adβgal (open boxes) or AdmRTVP-1 (closed boxes) at a multiplicity of infection of 100. Protein levels of mRTVP-1 in TSU-Pr1 cells were determined by Western blotting (inset) using an affinity-purified antibody to mRTVP-1. The levels of β-actin were also monitored as a loading control. (B) Morphological changes documented by phase-contrast microscopy (left panels) and fluorescence microscopy after DAPI staining (right panels). Arrows indicate apoptotic nuclei. 178-2 BMA images were taken 48 h postinfection; TSU-Pr1 images were taken 72 h postinfection. (C and D) Time courses of DNA fragmentation in 178-2 BMA (C) and TSU-Pr1 (D) after infection by Adβgal or AdmRTVP-1. DNA fragmentation was analyzed at indicated time points by using a Cell Death ELISA kit (Boehringer Mannheim).
FIG. 9.
FIG. 9.
Deletion of the signal peptide reduces RTVP-1-mediated apoptotic activities. Annexin V positivity (A) and DNA fragmentation (B) were analyzed 72 h after TSU-Pr1 cells were transfected with full-length RTVP-1 or the signal peptide deletion mutants described in Materials and Methods.

References

    1. Ashkenazi, A., and V. M. Dixit. 1998. Death receptors: signaling and modulation. Science 281:1305-1308. - PubMed
    1. Baker, S. J., S. Markowitz, E. R. Fearon, J. K. Willson, and B. Vogelstein. 1990. Suppression of human colorectal carcinoma cell growth by wild-type p53. Science 249:912-915. - PubMed
    1. Baley, P. A., K. Yoshida, W. Qian, I. Sehgal, and T. C. Thompson. 1995. Progression to androgen insensitivity in a novel in vitro mouse model for prostate cancer. J. Steroid Biochem. Mol. Biol. 52:403-413. - PubMed
    1. Bunz, F., P. M. Hwang, C. Torrance, T. Waldman, Y. Zhang, L. Dillehay, J. William, C. Lengauer, K. W. Kinzler, and B. Vogelstein. 1999. Disruption of p53 in human cancer cells alters the responses to therapeutic agents. J. Clin. Investig. 104:263-269. - PMC - PubMed
    1. Burns, T. F., and W. S. El-Deiry. 1999. The p53 pathway and apoptosis. J. Cell. Physiol. 181:231-239. - PubMed

Publication types

MeSH terms