. 2002 Apr 30;99(9):6340-5.
doi: 10.1073/pnas.052151299. Epub 2002 Apr 23.

General and variable features of varicosity spacing along unmyelinated axons in the hippocampus and cerebellum

Affiliations

General and variable features of varicosity spacing along unmyelinated axons in the hippocampus and cerebellum

Gordon M G Shepherd et al. Proc Natl Acad Sci U S A. .

Abstract

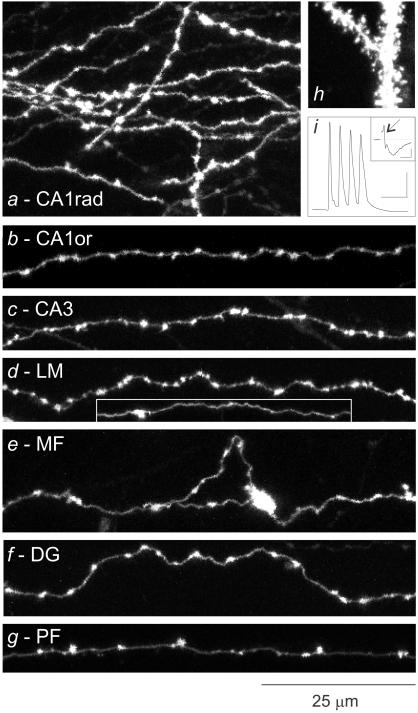
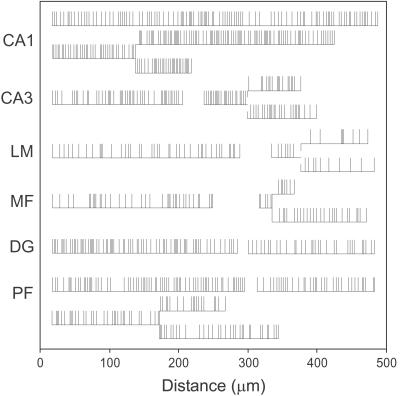
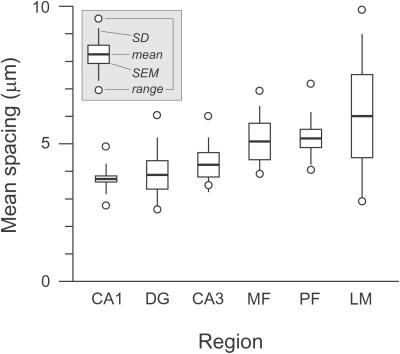
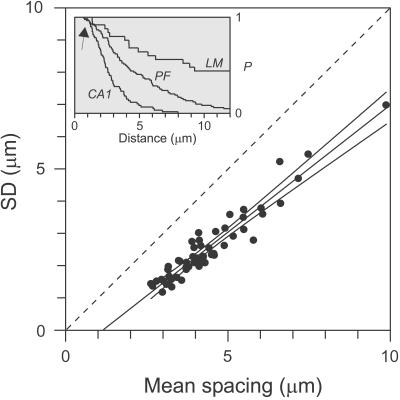
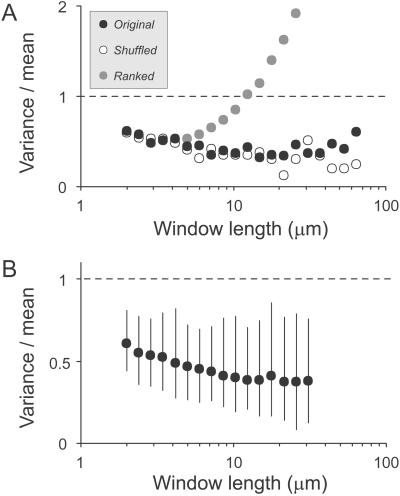
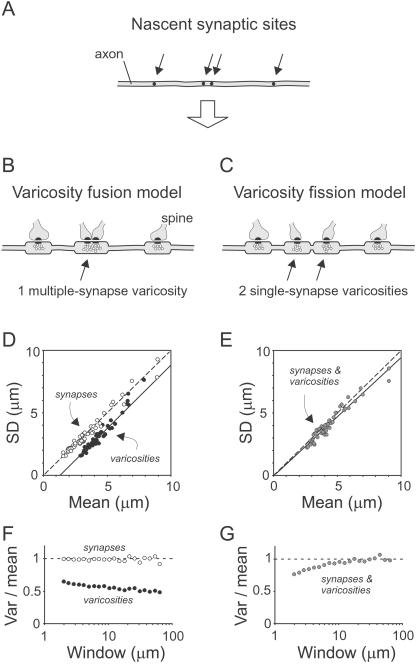
Along unmyelinated central axons, synapses occur at focal swellings called axonal varicosities (boutons). The mechanisms regulating how frequently synapses and varicosities occur along axons remain poorly understood. Here, to investigate varicosity distribution patterns and the extent to which they may be conserved across different axons, we analyzed varicosity numbers and positions along fluorescently labeled axon branches in hippocampal area CA1 (CA3-to-CA1 "Schaffer collateral" axons) and five other synaptic regions of rat hippocampus and cerebellum. Varicosity spacing varied by region; e.g., 3.7 +/- 0.6 microm (mean +/- SD) for CA3-to-CA1 axons and 5.2 +/- 1.0 microm for cerebellar parallel fibers. Surprisingly, when 56 axons from these different regions were pooled into a single heterogeneous group, a general relationship emerged: the spacing variability (SD) was a constant fraction of the mean spacing, suggesting that varicosities along different axons are distributed in a fundamentally similar, scaled manner. Varicosity spacing was neither regular nor random but followed a pattern consistent with random synaptic distributions and the occurrence of multiple-synapse boutons. A quantitative model reproduced the salient features of the data and distinguished between two proposed mechanisms relating axonal morphogenesis and synaptogenesis.


Figures

Figure 1
Figure 1
Morphological features of varicose axons in different synaptic regions. (A--G) Collapsed views of axons from a variety of synaptic layers in the hippocampus and cerebellum. (H) Spiny dendrites from area CA1. (I) Train of four action potentials, elicited in the axon and antidromically propagated to and intracellularly recorded at the soma; Inset shows compound action potentials (arrow) followed by synaptic potentials, recorded extracellularly. Bars = 25 msec, 25 mV; Inset, 2.5 msec, 0.25 mV.
Figure 2
Figure 2
Examples of linearly transformed axons from each synaptic region, illustrating the variability in varicosity numbers and positions. Vertical lines indicate varicosities. Small vertical gaps at two of the branch points indicate branching that occurred along a bare axon (i.e., not at a varicosity).
Figure 3
Figure 3
Regional variability in mean varicosity spacing.
Figure 4
Figure 4
Intervaricosity interval analysis. SD vs. mean spacing plotted for all axons. Identity line (dashed) with slope = 1 indicates Poisson relationship. Line through data, y = 0.79x − 0.91, was obtained by linear regression and extrapolated to the x axis. Also shown are the ±99% confidence intervals. (Inset) Representative interval distributions for three axons, including a PF and fibers in CA1 and LM, plotted as survival functions (inverse rank-ordered sets of intervals); for any distance in micrometers, P is the fraction of varicosities separated by at least that amount. Arrow points to gaps in distributions at shortest distances.
Figure 5
Figure 5
Window analysis. (A) Index of dispersion (variance/mean) vs. window length, for a single axon (●). For comparison, the axon's sequence of the intervaricosity intervals was randomly shuffled (○) or ordered by rank (gray circles). (B) Overall averages of all axons' indices of dispersion, for different window lengths, shown with 5–95% confidence intervals.
Figure 6
Figure 6
Models of synapse-varicosity relationships. (A) Positions (arrows) along an axon where synapses and subsequently varicosities will form. (B and C) Two models of how varicosities form near synapses. In the varicosity fusion model, varicosities 1.0 μm in length form around every synapse. If two synapses are closer than the varicosity length, their varicosities are fused into one longer varicosity, creating a MSB. In the varicosity fission model, MSBs are converted into two single-synapse boutons by sliding synapses apart. (D and E) SD vs. mean spacing for axons simulated according to the two models. (F and G) Indices of dispersion for simulated axons. ●, Varicosity data; ○, synaptic data; and gray circles, overlapping synaptic and varicosity data.

Similar articles

Cited by

References

    1. Ishizuka N, Weber J, Amaral D G. J Comp Neurol. 1990;295:580–623. - PubMed
    1. Li X G, Somogyi P, Ylinen A, Buzsáki G. J Comp Neurol. 1994;339:181–208. - PubMed
    1. Westrum L E, Blackstad T W. J Comp Neurol. 1962;119:281–309. - PubMed
    1. Napper R M A, Harvey R J. J Comp Neurol. 1988;274:168–177. - PubMed
    1. Shepherd G M G, Harris K M. J Neurosci. 1998;18:8300–8310. - PMC - PubMed

Publication types

LinkOut - more resources