. 2002 Apr 30;99(9):6263-8.
doi: 10.1073/pnas.082110799. Epub 2002 Apr 23.

Hemagglutinin sequence clusters and the antigenic evolution of influenza A virus

Affiliations

Hemagglutinin sequence clusters and the antigenic evolution of influenza A virus

Joshua B Plotkin et al. Proc Natl Acad Sci U S A. .

Abstract

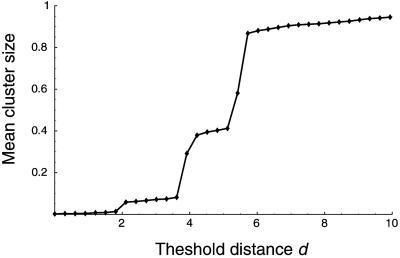
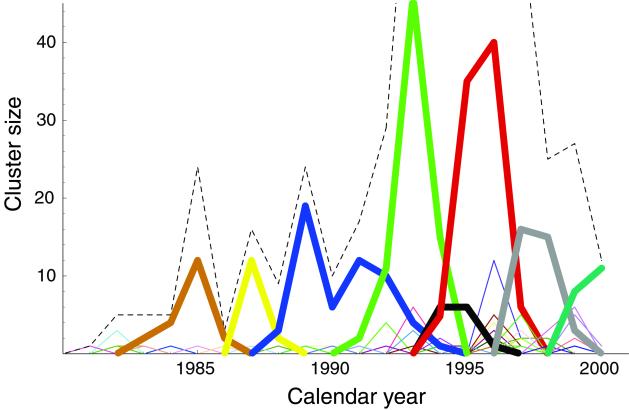
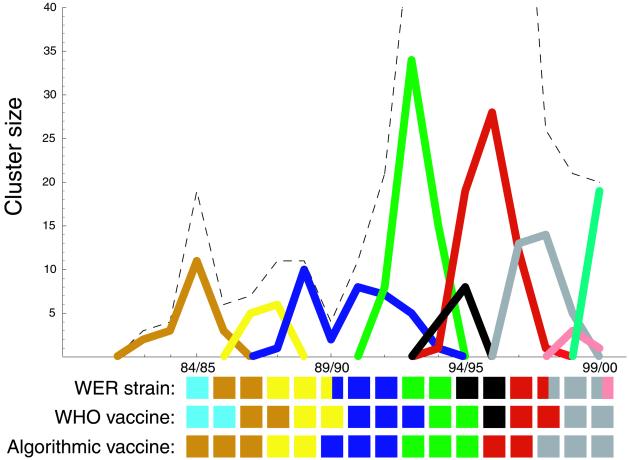
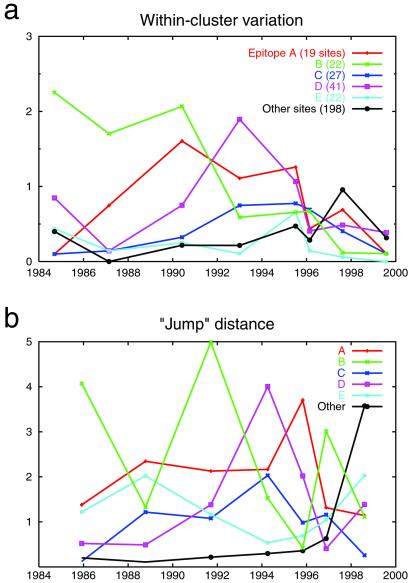
Continual mutations to the hemagglutinin (HA) gene of influenza A virus generate novel antigenic strains that cause annual epidemics. Using a database of 560 viral RNA sequences, we study the structure and tempo of HA evolution over the past two decades. We detect a critical length scale, in amino acid space, at which HA sequences aggregate into clusters, or swarms. We investigate the spatio-temporal distribution of viral swarms and compare it to the time series of the influenza vaccines recommended by the World Health Organization. We introduce a method for predicting future dominant HA amino acid sequences and discuss its potential relevance to vaccine choice. We also investigate the relationship between cluster structure and the primary antibody-combining regions of the HA protein.


Figures

Figure 1
Figure 1
The cluster-size curve for 560 sequences of HA1. This curve shows the relationship between the threshold distance d (at which to connect two sequences into the same cluster) and the mean cluster size C(d), defined as the normalized first moment of the resulting distribution of cluster sizes. Equivalently, C(d) is the probability that two randomly chosen sequences lie in the same cluster. Plateaus in the cluster size curve correspond to stable length scales at which the sequences form nonrandom clusters. Random data would not exhibit any plateaus except for C = 0 and C = 1 (18). The smooth cluster size curve results from averaging over 100 probabilistic Gaussian draws for each mean distance parameter d, with a 5% coefficient of variation (18). The HA1 data exhibit two significant plateaus corresponding to clusterings at d = 2–3 and d = 4–5. The long tail for d ≥ 6 corresponds to the gradual accumulation of outlier sequences. When d = 2, there are 174 resulting clusters with C (2) = 0.0614; at this scale, the expected size of the cluster containing a randomly chosen sequence is 560 × 0.0614 = 34.4 sequences. (The clustering for d = 3 is extremely similar to d = 2, as the first plateau indicates.)
Figure 2
Figure 2
The number of HA1 sequences within each cluster plotted as a function of calendar year of isolation. The clustering shown here corresponds to d = 2 amino acids (see Fig. 1). Each cluster is indicated by a different color, with the eight largest clusters shown in bold. The dashed line indicates the total number of isolates in the data set each year. The dominant sequence clusters tend to replace each other every 2–5 years. The dominant cluster in each year accounts for more than 25% of the sequences isolated that year. (The number of sequences each year does not reflect the severity of infections, but rather the temporal biases in the sequence data set.)
Figure 3
Figure 3
The number of HA1 sequences within each cluster plotted as a function of influenza season. The graph shows the eight largest clusters as well as any other clusters that contain sequences used in a WHO vaccine. The tiles denoted “WHO vaccine” indicate the ‘color’ of the WHO-recommended vaccine in each season, e.g., the color of the cluster corresponding to the strain on which each vaccine was based. The tiles denoted “Algorithmic vaccine” indicate the color of vaccine prescribed each season by the algorithm proposed in the main text (the dominant cluster from the previous season). The tiles denoted “WER strain” indicate the color of the dominant antigenic type, based on HI assays, as reported by the WHO in its Weekly Epidemiological Record (40–56). (Note that one of the three strains reported in WER for 1999–2000 is missing from the Los Alamos sequence database.) Both vaccines tend to match the WER strains well; in some seasons the WHO vaccine matches better, and in some seasons the algorithmic vaccine matches better.
Figure 4
Figure 4
Strain names of representative members from each of the clusters seen in Fig. 3. Note that strains considered as antigenically distinct by the WHO (using HI assay) can fall in the same cluster.
Figure 5
Figure 5
Within-cluster variation (a) and between-cluster distances (b), by epitope, for the eight largest clusters in our data set. Within-cluster variation is calculated as the mean pairwise Hamming distance, restricted to sites in a given epitope, among sequences in a cluster. The abscissa shows the mean of the calendar years for each cluster's sequences. Note that the amount of variation among the 198 nonepitopic sites is of roughly the same magnitude as variation in each of the epitopes. In b, the distance between successive clusters is calculated as the distance between the cluster centroids in Hamming space (using the Manhattan metric). The abscissa shows the temporal midpoint of the two clusters being compared. Note that the epitope with the largest inter-cluster change is never repeated in two successive “jumps.”

References

    1. Hayden F G, Palese P. In: Clinical Virology. Richman D, Whitley R J, Hayden F G, editors. New York: Churchill Livingstone; 1997. pp. 911–942.
    1. Webster R G, Bean W J, Gorman O T, Chambers T M, Kawaoka Y. Microbiol Rev. 1992;56:152–179. - PMC - PubMed
    1. Fitch W M, Bush R M, Bender C A, Cox N J. Proc Natl Acad Sci USA. 1997;94:7712–7718. - PMC - PubMed
    1. Webster R G. Emerg Infect Dis. 1998;4:436–441. - PMC - PubMed
    1. Fitch W M, Bush R M, Bender C A, Subbarao K, Cox N J. J Hered. 2000;91:183–185. - PubMed

Publication types