. 2002 Apr 30;99(9):6210-5.
doi: 10.1073/pnas.082121299. Epub 2002 Apr 23.

Slowed conduction and ventricular tachycardia after targeted disruption of the cardiac sodium channel gene Scn5a

Affiliations

Slowed conduction and ventricular tachycardia after targeted disruption of the cardiac sodium channel gene Scn5a

G Alex Papadatos et al. Proc Natl Acad Sci U S A. .

Abstract

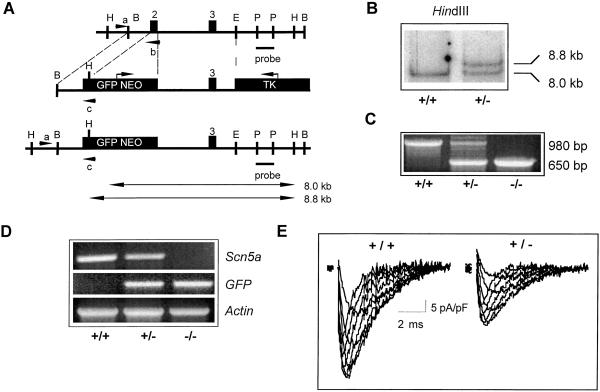
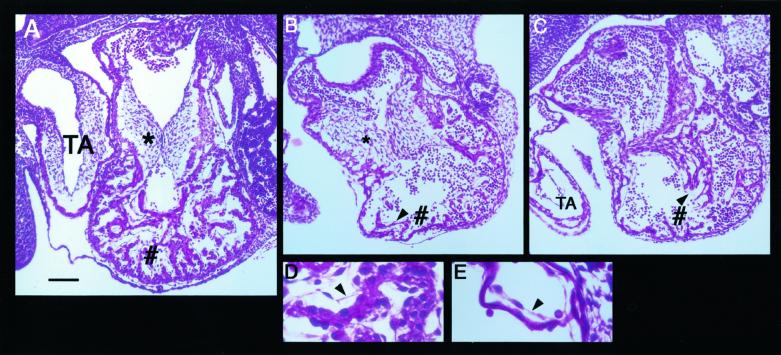
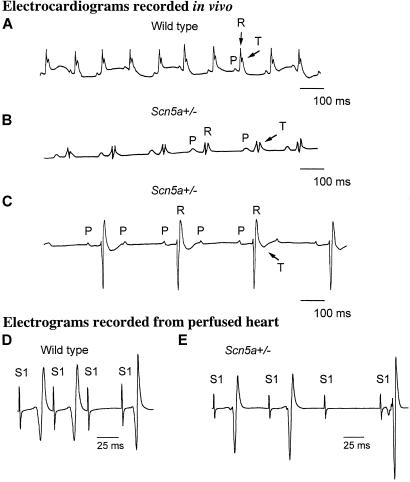
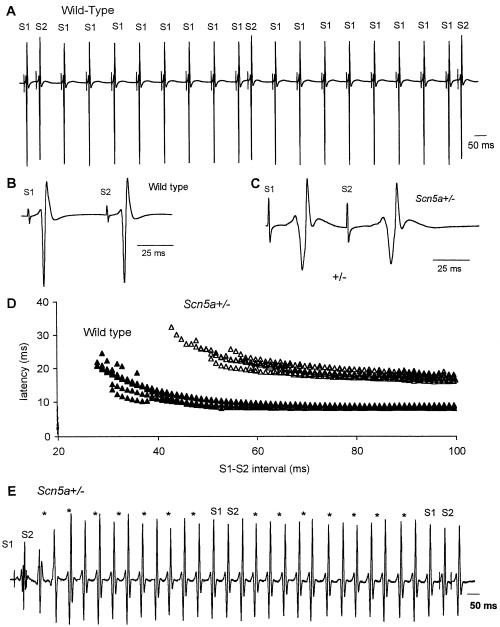
Voltage-gated sodium channels drive the initial depolarization phase of the cardiac action potential and therefore critically determine conduction of excitation through the heart. In patients, deletions or loss-of-function mutations of the cardiac sodium channel gene, SCN5A, have been associated with a wide range of arrhythmias including bradycardia (heart rate slowing), atrioventricular conduction delay, and ventricular fibrillation. The pathophysiological basis of these clinical conditions is unresolved. Here we show that disruption of the mouse cardiac sodium channel gene, Scn5a, causes intrauterine lethality in homozygotes with severe defects in ventricular morphogenesis whereas heterozygotes show normal survival. Whole-cell patch clamp analyses of isolated ventricular myocytes from adult Scn5a(+/-) mice demonstrate a approximately 50% reduction in sodium conductance. Scn5a(+/-) hearts have several defects including impaired atrioventricular conduction, delayed intramyocardial conduction, increased ventricular refractoriness, and ventricular tachycardia with characteristics of reentrant excitation. These findings reconcile reduced activity of the cardiac sodium channel leading to slowed conduction with several apparently diverse clinical phenotypes, providing a model for the detailed analysis of the pathophysiology of arrhythmias.


Figures

Figure 1
Figure 1
Disruption of Scn5a locus. (A) Structure of wild-type Scn5a locus, targeting vector, and targeted locus. Insertion of neo cassette replaced the first coding exon. Restriction sites (B, BamHI; H, HindIII; P, PstI; E, EcoRV) and the probe used for detection of the homologous recombination event by Southern analysis are shown. Expected fragment sizes of wild-type (8.0 kb) and mutant alleles (8.8 kb) after HindIII digestion are indicated. PCR primers used for screening of embryonic stem (ES) cells and genotyping of mouse tail DNA are shown (ac). TK, thymidine kinase; GFP, green fluorescent protein. (B) Southern blot of HindIII-digested ES cell DNA. (C) PCR genotyping of E10.5 embryos identifying wild type, Scn5a+/−, and Scn5a−/−. (D) Reverse transcription–PCR analysis of Scn5a, GFP, and Actin transcripts in Scn5a−/−, Scn5a+/− , and wild-type embryos. Scn5a deletion is confirmed in Scn5a−/− mutants with transcription of GFP and Actin as controls. (E) Typical examples of currents recorded from wild-type and heterozygous myocytes during depolarization steps from −100 mV to voltages between −50 to −15 mV in 5-mV increments (see Table 1). The peak current densities in wild-type myocytes were typically larger than those in Scn5a+/− myocytes (see text for details).
Figure 2
Figure 2
Morphology of E10.5 wild-type and Scn5a−/− hearts. Nine Scn5a−/− embryos and four control embryos (wild type or Scn5a+/−) were examined. (A) Representative sagittal paraffin section of a control E10.5 heart stained with hematoxylin and eosin. The myocardial wall of the common ventricular chamber shows extensive trabeculation (#) and the endocardial cushions of the atrioventricular canal (*) are well developed. Also, at this stage the truncus arteriosus (TA) shows the first signs of the formation of the aorticopulmonary spiral septum. (B and C) Representative sections of hearts from E10.5 Scn5a−/− embryos. Note the well developed endocardial cushions (*) and TA but little trabeculation of the ventricular wall (#). (D and E) High-magnification views of the cardiomyocytes and endothelial cells from control (D) and Scn5a−/− (E) embryos. Arrowheads (in BE) indicate the endothelial cell layer surrounding the trabeculated myocardium and lining the ventricular chamber. [Bar = 100 μm (in AC) and 25 μm (in D and E).]
Figure 3
Figure 3
ECGs and atrioventricular conduction in wild-type and Scn5a+/− mice. (A) Representative single-lead ECG strip (standard lead I) from wild-type mouse with P waves (P) caused by atrial depolarization, QRS complexes (R) caused by ventricular depolarization, and T waves (T) caused by ventricular repolarization. The cycle length is 120 ms with successful 1:1 conduction from the atria to the ventricles. P wave duration (18 ms) and PR interval (35 ms) are comparable to those reported for mouse (35). (B) Lead I of representative ECG taken from Scn5a+/− mouse showing 1:1 atrioventricular conduction and cycle length of 220 ms. There is increased P wave duration (26 ms) and prolonged PR interval (60 ms) when compared with wild type. (C) Rhythm strip (lead II) taken from Scn5a+/− mouse showing conduction of only every second atrial beat (P) to the ventricle (R), indicating second-degree atrioventricular block. Atrial cycle length is 170 ms, and ventricular cycle length is 340 ms. The PR interval is prolonged (60 ms) with a rightward shift in the QRS axis indicative of widespread atrioventricular conduction delay (outbred Scn5a+/− mouse) with associated T wave inversion. (D) Characteristics of atrioventricular nodal conduction in wild-type Langendorff-perfused heart during right atrial pacing and left ventricular epicardial recording. Far-field atrial pacing stimulation artifacts (S1) and resulting ventricular electrograms are shown. The stimulus interval of the paced beats (S1-S1) is progressively reduced with the third artifact shown delivered at a stimulus interval of 42 ms and not conducted to the ventricle (Wenckebach block), which is compatible with previous results obtained in vivo, e.g., controls in the description of the phenotype of connexin40 mutant mice (35). (E) Representative recording from Scn5a+/− hearts obtained under identical conditions to D. In this example, atrioventricular conduction is significantly impaired with the third atrial paced beat (S1) delivered at a stimulus interval (S1-S1) of 70 ms not conducted to the ventricle (see Table 2).
Figure 4
Figure 4
Assessment of conduction properties and ventricular tachycardia in Langendorff-perfused mouse ventricular preparations. (A) Illustration of continuous electrical recordings from the base of the left ventricle in response to stimuli applied to the right ventricular septum. The interval between stimuli is 100 ms except that S2 follows the preceding S1 stimulus at an interval that is decreased progressively in 1-ms steps, starting at 99 ms. In this example, the three S1-S2 intervals shown are (left to right) 49, 48, and 47 ms. (B) Earlier section of trace shown in A on expanded time base (× 5.8). S1-S2 interval 55 ms. (C) Recording from Scn5a+/− ventricle, also with S1-S2 interval 55 ms. Latency and duration of electrogram are greater in Scn5a+/− than in wild type (24 and 56 ms, respectively, after S1 in C; 10 and 40 ms in B). After S2, latency is considerably increased (13 ms in B and 32 ms in C) whereas duration is only slightly increased. The number of components in the electrogram [termed fractionation (32, 42)] is not increased in the Scn5a+/− preparation. (D) Latency of electrogram in response to each S2 stimulus was measured in a record similar to A and is plotted here against the corresponding S1-S2 interval for 9 wild-type preparations (filled triangles) and for 6 Scn5a+/− preparations (open triangles). For all S1-S2 intervals, latency is much longer in Scn5a+/− than in wild type. The ventricular effective refractory period (value of S1-S2 interval as which response fails) is greater in Scn5a+/− (56 ± 7) than in wild type (29 ± 1, P < 0.001). (E) Representative electrical recording from Scn5a+/− ventricular preparation. S2 delivery at 49-ms stimulus interval (far left of trace) is followed by a delayed (latency, 52 ms) ventricular response that initiates ventricular tachycardia (asterisks represent points of S1 delivery with shock artifacts removed for clarity). The tachycardia is organized, and monomorphic of mean cycle length is 64 ms (the cycle length in individual traces varied in the range of 60–70 ms). There is no response to the delivery of S1 stimuli at 100-ms cycle length (asterisks). Delivery at an S1-S2 stimulus interval of 47 ms captures the ventricle (only ≈15 ms after the end of the previous ventricular depolarization) and terminates the tachycardia.

Comment in

Similar articles

Cited by

References

    1. Spooner P M, Rosen M R, editors. Foundations of Cardiac Arrhythmias: Basic and Clinical Approaches. New York: Dekker; 2001.
    1. The Sicilian Gambit. Cardiovasc Res. 2001;52:345–360. - PubMed
    1. Keating M T, Sanguinetti M C. Cell. 2001;104:569–580. - PubMed
    1. Marban E. Nature (London) 2002;415:213–218. - PubMed
    1. Roden D M, Balser J R, George A L, Jr, Anderson M E. Annu Rev Physiol. 2002;64:431–475. - PubMed

Publication types

Substances