. 2002 Apr 30;99(9):5982-7.
doi: 10.1073/pnas.082666399. Epub 2002 Apr 23.

Functional role of internal water molecules in rhodopsin revealed by X-ray crystallography

Affiliations

Functional role of internal water molecules in rhodopsin revealed by X-ray crystallography

Tetsuji Okada et al. Proc Natl Acad Sci U S A. .

Abstract

Activation of G protein-coupled receptors (GPCRs) is triggered and regulated by structural rearrangement of the transmembrane heptahelical bundle containing a number of highly conserved residues. In rhodopsin, a prototypical GPCR, the helical bundle accommodates an intrinsic inverse-agonist 11-cis-retinal, which undergoes photo-isomerization to the all-trans form upon light absorption. Such a trigger by the chromophore corresponds to binding of a diffusible ligand to other GPCRs. Here we have explored the functional role of water molecules in the transmembrane region of bovine rhodopsin by using x-ray diffraction to 2.6 A. The structural model suggests that water molecules, which were observed in the vicinity of highly conserved residues and in the retinal pocket, regulate the activity of rhodopsin-like GPCRs and spectral tuning in visual pigments, respectively. To confirm the physiological relevance of the structural findings, we conducted single-crystal microspectrophotometry on rhodopsin packed in our three-dimensional crystals and show that its spectroscopic properties are similar to those previously found by using bovine rhodopsin in suspension or membrane environment.


Figures
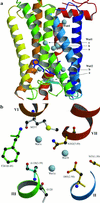
Figure 1
Figure 1
(a) Global view of the transmembrane helical region of the refined bovine rhodopsin structure. The cytoplasmic surface is shown in the upper side. The four water-binding sites (Wat1–4) include seven water molecules (light blue spheres). Details of the sites are summarized in Table 2. (b) Detailed view of the Wat1 site. The residues surrounding Wat1a, -b, and -c are shown as ball-and-stick representation in standard atom colors. Colors of the stick are yellow for the conserved residues, cyan for Ala-124, and green for Phe-261. Numbers in parentheses are according to ref. . Figures were prepared with molscript (38) and raster3d (39).
Figure 2
Figure 2
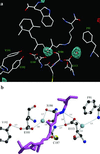
(a) View of the retinal-binding site and electron densities for the two water molecules (Wat2a and Wat2b, red spheres) found in the vicinity of retinal Schiff base. σA-weighted FoFc omit map calculated for the waters at 2.6 Å is contoured at 4.0 σ with positive densities in blue. The figure was prepared with spdbv (40). (b) Hydrogen bond network around the Schiff base. Retinal and Lys-296 are shown in purple with the NZ position in blue, and the surrounding residues are represented as ball-and-stick figures in standard colors. Wat2a and Wat2b are shown as light-blue spheres. Each of the distances (Å) is an averaged value from molecule A and molecule B in an asymmetric unit. The figure was prepared with molscript (38) and raster3d (39).
Figure 3
Figure 3
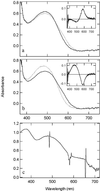
Rhodopsin absorption spectra obtained by single-crystal microspectrophotometry. (a) Ground state spectrum of a rhodopsin crystal (solid line). After illumination with argon laser (488 nm, 7 mW) at 100 K for 1 min, the spectrum shown by the dotted line was recovered. (Inset) The difference spectrum between the dotted and solid curves, which is consistent with formation of bathorhodopsin (29). (b) The illuminated crystal (solid line, identical to the dotted line in spectrum a) was warmed up to 140 K (rate = 3 K/min) and cooled down to 100 K. The spectrum shown in the dotted line was recovered. The interval between the onset of warming and the measurement at 100 K was ≈15 min. (Inset) The difference spectrum between the two curves, which is consistent with the spectral change from bathorhodopsin to lumirhodopsin. (c) The rhodopsin crystal was first illuminated at 5°C for 3 min with >540-nm light and flash frozen with liquid nitrogen. The time interval between the end of illumination and freezing was ≈3 min. The 380-nm product corresponds to M II. Spikes in the spectrum are due to fluctuation of the probe light from the D2 lamp.

References

    1. Hofmann K P. In: Handbook of Biological Physics: Molecular Mechanisms in Visual Transduction. Stavenga D G, Degrip W J, Pugh E N Jr, editors. Vol. 3. New York: Elsevier/North–Holland; 2000. pp. 91–142.
    1. Yoshizawa T. Photochem Photobiol. 1992;56:859–867. - PubMed
    1. Schertler G F, Villa C, Henderson R. Nature (London) 1993;362:770–772. - PubMed
    1. Palczewski K, Kumasaka T, Hori T, Behnke C A, Motoshima H, Fox B A, Le Trong I, Teller D C, Okada T, Stenkamp R E, et al. Science. 2000;289:739–745. - PubMed
    1. Teller D C, Okada T, Behnke C A, Palczewski K, Stenkamp R A. Biochemistry. 2001;40:7761–7772. - PMC - PubMed

Publication types

Associated data

LinkOut - more resources