. 2002 Apr 30;99(9):6328-33.
doi: 10.1073/pnas.082714499. Epub 2002 Apr 23.

Naturally occurring rhodopsin mutation in the dog causes retinal dysfunction and degeneration mimicking human dominant retinitis pigmentosa

Affiliations

Naturally occurring rhodopsin mutation in the dog causes retinal dysfunction and degeneration mimicking human dominant retinitis pigmentosa

James W Kijas et al. Proc Natl Acad Sci U S A. .

Abstract

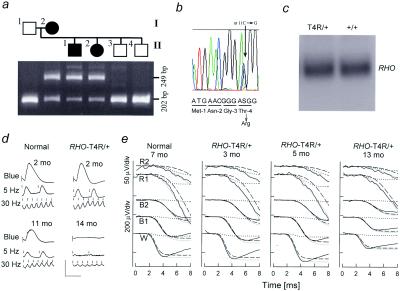
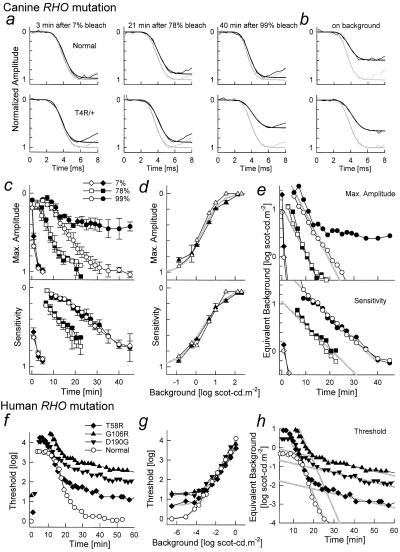
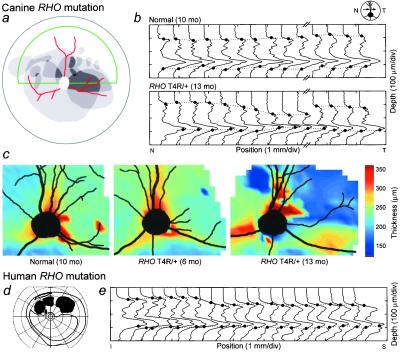
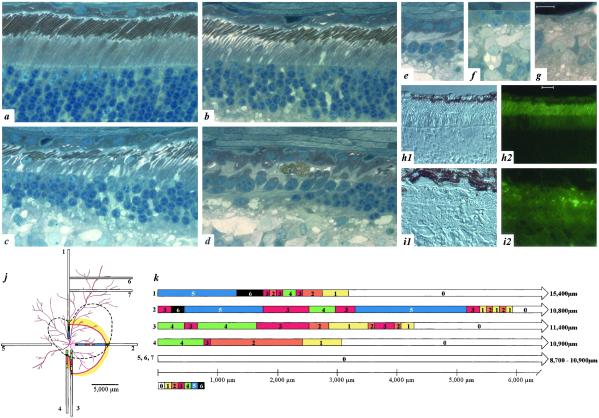
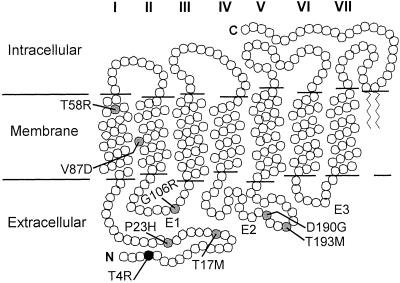
Rhodopsin is the G protein-coupled receptor that is activated by light and initiates the transduction cascade leading to night (rod) vision. Naturally occurring pathogenic rhodopsin (RHO) mutations have been previously identified only in humans and are a common cause of dominantly inherited blindness from retinal degeneration. We identified English Mastiff dogs with a naturally occurring dominant retinal degeneration and determined the cause to be a point mutation in the RHO gene (Thr4Arg). Dogs with this mutant allele manifest a retinal phenotype that closely mimics that in humans with RHO mutations. The phenotypic features shared by dog and man include a dramatically slowed time course of recovery of rod photoreceptor function after light exposure and a distinctive topographic pattern to the retinal degeneration. The canine disease offers opportunities to explore the basis of prolonged photoreceptor recovery after light in RHO mutations and determine whether there are links between the dysfunction and apoptotic retinal cell death. The RHO mutant dog also becomes the large animal needed for preclinical trials of therapies for a major subset of human retinopathies.


Figures

Figure 1
Figure 1
Autosomal dominant PRA (adPRA) caused by RHO T4R mutation. (a) A normal, male, mixed-breed dog (I:1) was crossbred to an adPRA-affected female Mastiff (I:2). Among the six progeny (II:1–4 shown), two were affected with PRA at 12 mo of age and four were normal. PCR restriction fragment length polymorphism analysis with BsmFI in the normal sire (I:1) yields one fragment of 202 bp; the affected dam (II:2) has an additional 249-bp fragment diagnostic of the T4R mutation. (b) RHO sequence analysis from an affected dog shows the heterozygous C > G transversion at position 11, which predicts substitution of Arg for Thr at residue 4. (c) Northern blot analysis shows no difference in RHO expression comparing an RHO T4R/+ and wild-type animal. (d) ERGs recorded from dark-adapted RHO mutant and control dogs. Each vertical image presents the responses to a blue flash, to 5-Hz low-intensity white light flashes, and to 30-Hz high-intensity white light flicker: these elicit rod b-waves, rod-, and cone-specific responses, respectively. Upper images show recordings from normal (rod b-wave amplitude mean = 234.9 μV; SEM = 20.3 μV and cone flicker mean = 63.9 μV; SEM = 4.7 μV) and T4R/+ dogs (rod mean = 202.5 μV, SEM = 13.5 μV; cone mean = 60 μV, SEM = 2.8 μV) each at 2 mo of age (mo). These were not significantly different (P = 0.2 and 0.5, respectively). Lower images show recordings from a normal dog at 11 mo and a T4R/+ animal at 14 mo where rod and cone ERGs are markedly reduced, although cone responses show relative preservation. (e) ERG photoresponses (thin noisy lines) in a representative normal dog and three RHO mutant dogs evoked by one white (W), two blue (B1, B2), and two red (R1, R2) flash stimuli. Waveforms are fitted with a phototransduction activation model (thick line) that is the sum of rod (dashed lines) and cone (dotted lines) components. T4R/+ dogs at 3–6 mo of age have rod (Max. Amplitude, Rmax = 249 ± 14 μV; sensitivity, σ = 3.46 ± 0.11 log scot-cd−1⋅m2⋅s−3) and cone (Rmax = 26.1 ± 5.0 μV; σ = 3.93 ± 0.22 log phot-cd−1⋅m2⋅s−3) photoresponses within the normal range (rod: Rmax = 242 ± 12 μV, σ = 3.52 ± 0.09 log scot-cd−1⋅m2⋅s−3; cone: Rmax = 26.6 ± 1.3 μV, σ = 3.89 ± 0.11 log phot-cd−1⋅m2⋅s−3). At 13 mo of age there were abnormal rod (Rmax = 147 μV, σ = 3.72 log scot-cd−1⋅m2⋅s−3) and cone (Rmax = 11.7 μV, σ = 4.09 log phot-cd−1⋅m2⋅s−3) photoresponses.
Figure 2
Figure 2
Bleaching and background adaptation in canine and human RHO mutations. (a and b) A model of rod phototransduction activation (smooth lines) fitted to the leading edges of rod-isolated ERG photoresponses (noisy lines) in representative normal and RHO T4R/+ mutant dogs. The photoresponses shown were evoked either fully dark-adapted (gray lines), or in the dark at specified times after three levels of bleaching flashes (a), or on a background of 1 scot-cd⋅m−2 (b). Ordinates are normalized by the maximum amplitude under fully dark-adapted conditions. (c) Recovery of maximum amplitude and sensitivity parameters as a function of time after bleaching flashes in normal wild-type (empty symbols) and RHO T4R/+ (filled symbols) dogs. Symbols and bars represent mean ± SEM. (d) Change of maximum amplitude and sensitivity parameters as a function of background luminance in wild-type (empty symbols) and RHO T4R mutant (filled symbols) dogs. Symbols and bars represent mean ± SE. Hyperbolic saturation functions (gray lines) with I0 of 0.3 and 0.35 log scot-cd⋅m−2 and n of 1.0 and 0.7 were fitted to maximum amplitude and sensitivity, respectively. (e) Recovery of equivalent background as a function of time for a range of adapting flashes estimated by applying the inverse of the saturation functions shown in d to the data in c. Parallel lines (gray) fitted to the two larger bleaches have slopes of −0.1 min−1 (Max. Amplitude) and −0.05 min−1 (Sensitivity) on semilogarithmic coordinates. (f) Thresholds (psychophysically determined) in representative normal (empty symbols) or RHO mutant (filled symbols) human subjects after an adapting light that bleached >95% of available rhodopsin; prebleach thresholds shown near time 0. (g) Thresholds obtained on a range of background levels. Normal background adaptation could be well described with a hyperbolic saturation function (gray lines) with I0 of −4.5 log scot-cd⋅m−2 and n of 0.85. Approximately equal elevations in absolute threshold and I0 described the data from the patients. (h) Recovery of equivalent background as a function of time after the bright adapting light was estimated by applying the inverse of the saturation functions shown in g to the data in f. The major portion of normal recovery and the portion of recovery before the abnormal interruption in patients could be fitted with a line (gray) of −0.25 min−1 slope on semilogarithmic coordinates. Recovery of patient thresholds continued at an abnormally slow slope of −0.025 min−1.
Figure 3
Figure 3
Regional retinal disease gradient in canine and human RHO mutations. (a) Superimposed drawings of ophthalmoscopically evident lesions in one eye each from four RHO mutant dogs (displayed as left eyes) illustrate the range of topographic variation in disease. Darker grays represent higher frequencies of overlap of lesions among eyes. Lesions are drawn superimposed on a schematic of the dog fundus; green outlines tapetal area; red are blood vessels; white circle is the ONH. (b) OCT LRPs from an 8-mm-long horizontal scan located ≈3.3 mm superior to the ONH for a normal dog and right eye of an RHO T4R mutant dog; arrow is region from which LRPs are derived. For the normal dog, retinal thickness is the same throughout the length of the scan; the mutant dog shows distinct regions of thinning. (c) Topographical maps of retinal thickness in the left eyes of normal and RHO T4R/+ mutant dogs. A very small focus of retinal thinning in the 6-mo-old dog and a larger area of thinning in the 13-mo-old mutant dog are apparent in the superior temporal quadrants. (d) Kinetic visual field showing an altitudinal defect in a patient with adRP caused by an RHO G106R mutation. (e) LRPs derived from scans from the region indicated by the arrow on the visual field. The retina becomes progressively thinner as the scan moves toward the region of dysfunction.
Figure 4
Figure 4
Retinal disease morphology and RHO immunocytochemistry. (ag) Sections from an 11-mo-old RHO T4R/+ retina. (a) Normal section of T4R/+ retina. (b) Early rod loss is associated with drop out of diseased rods and shortened outer segments in remaining rods. (c and d) The degenerative phase is characterized by rod loss with preservation of cones. (eg) End-stage atrophy results in the progressive and sequential loss of all photoreceptors and retinal pigmented epithelium. (h1 and h2) Immunocytochemistry in a 2-mo-old RHO T4R/+ retina shows a normal pattern of intense opsin labeling limited to the outer segments. (i1 and i2) Examination of an 11-mo-old T4R/+ retina shows RHO label is present in the short, disorganized, outer segments of the few remaining rods adjacent to regions devoid of opsin staining where only cones remain. Calibration marker = 10 μm. (j) Location of 7 1-μm retinal plastic sections, extending from the optic disk to the periphery, taken to reconstruct the topographic distribution of disease. (k) Sections were evaluated in continuous overlapping fields and assigned stage 0–6 to correspond with disease severity as defined in ag, respectively. All regions are drawn to scale. More severe disease (stages 3–6) was observed surrounding the ONH and centered in the temporal tapetal region of the fundus. Dotted line indicates approximate area of retinal thinning apparent on gross examination of the fixed eyecup; colored line represents inferred margin of degenerate area from evaluation of fixed sections.
Figure 5
Figure 5
A secondary structure model of rhodopsin indicating the transmembrane helices (I–VII), interhelical loops of the extracellular domain (E1–E3), the intracellular and extracellular domains, and the locations of residues (circles) altered in canine (black) and human (gray) RHO mutations leading to a similar phenotype.

References

    1. Spiegel A M. Annu Rev Physiol. 1995;58:143–170. - PubMed
    1. Rattner A, Sun H, Nathans J. Annu Rev Genet. 1999;33:89–131. - PubMed
    1. Palczewski K, Kumasaka T, Hori T, Behnke C A, Motoshima H, Fox B A, Le Trong I, Teller D C, Okada T, Stenkamp R E, et al. Science. 2000;289:739–745. - PubMed
    1. Gal A, Apfelstedt-Sylla E, Janecke A R, Zrenner E. Prog Ret Eye Res. 1997;16:51–79.
    1. Cideciyan A V, Hood D C, Huang Y, Banin E, Li Z-Y, Stone E M, Milam A H, Jacobson S G. Proc Natl Acad Sci USA. 1998;95:7103–7108. - PMC - PubMed

Publication types

Associated data

LinkOut - more resources