. 2002 Apr 30;99(9):5860-5.
doi: 10.1073/pnas.092538799. Epub 2002 Apr 23.

Precision and functional specificity in mRNA decay

Affiliations

Precision and functional specificity in mRNA decay

Yulei Wang et al. Proc Natl Acad Sci U S A. .

Abstract

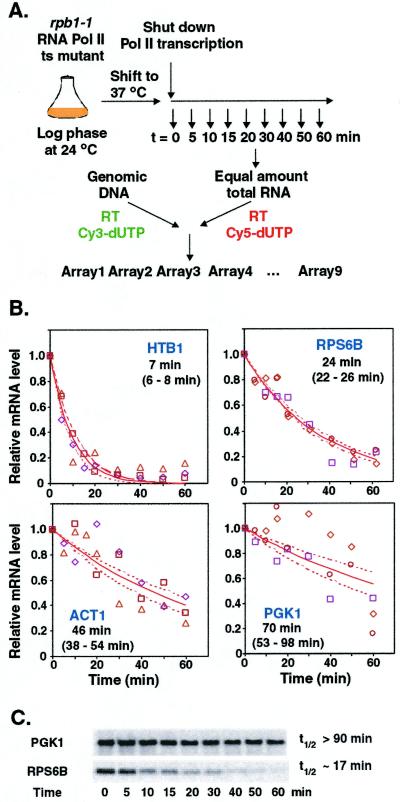
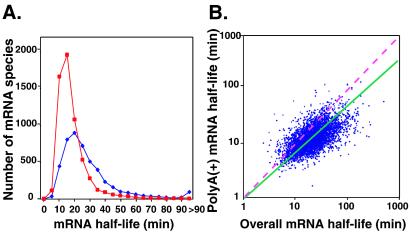
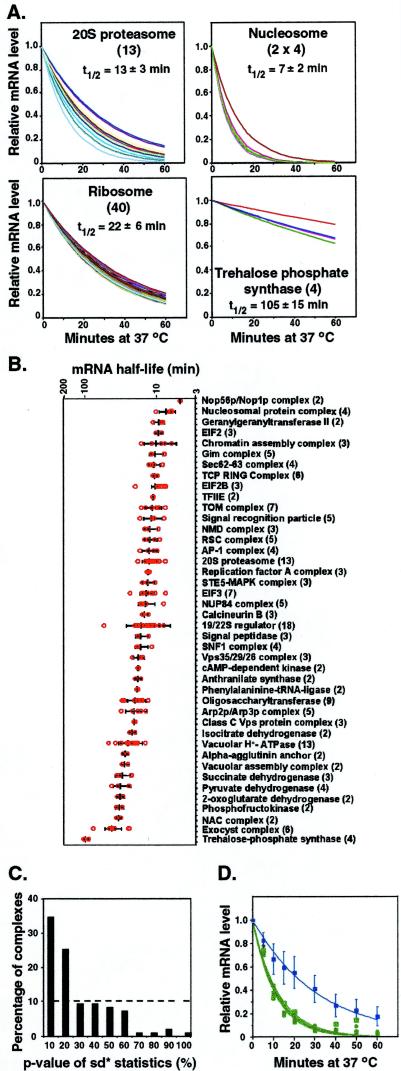
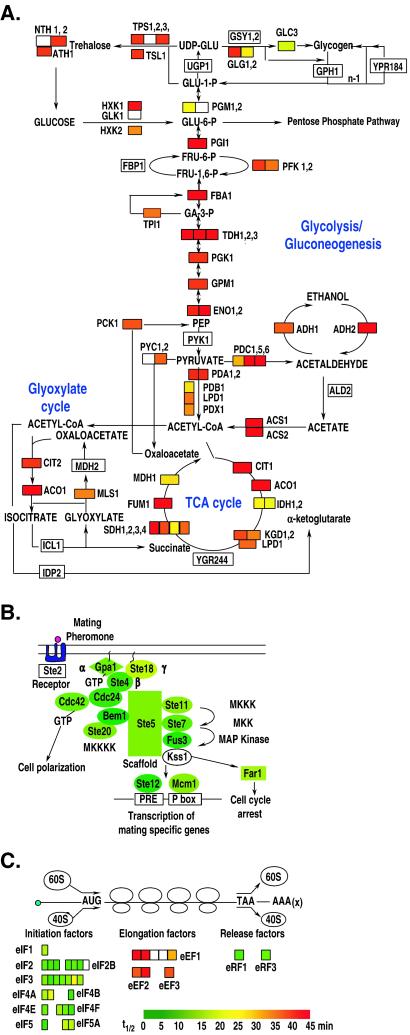
Posttranscriptional processing of mRNA is an integral component of the gene expression program. By using DNA microarrays, we precisely measured the decay of each yeast mRNA, after thermal inactivation of a temperature-sensitive RNA polymerase II. The half-lives varied widely, ranging from approximately 3 min to more than 90 min. We found no simple correlation between mRNA half-lives and ORF size, codon bias, ribosome density, or abundance. However, the decay rates of mRNAs encoding groups of proteins that act together in stoichiometric complexes were generally closely matched, and other evidence pointed to a more general relationship between physiological function and mRNA turnover rates. The results provide strong evidence that precise control of the decay of each mRNA is a fundamental feature of the gene expression program in yeast.


Figures

Figure 1
Figure 1
Whole-genome determination of mRNA half-lives. (A) Schematic of the DNA microarray procedure for determining genomewide mRNA half-lives. Total RNA was isolated at specified intervals after inactivation of RNA polymerase II. Fluorescently labeled cDNA probes were prepared from each RNA sample by reverse transcription in the presence of Cy5-dUTP. Yeast genomic DNA was similarly labeled with Cy3-dUTP to provide an internal hybridization standard for every gene. For each time point, Cy5-labeled probe was mixed with the Cy3-labeled genomic DNA standard and the mixtures were hybridized to DNA microarrays. (B) Examples of mRNA decay profiles determined by quantitative microarray analysis. The different symbols represent data from three independent time courses; the solid lines represent the nonlinear least squares fit to an exponential decay model; the dashed lines represent the upper and lower limits of the 95% confidence interval for the decay curves, determined by the bootstrapping procedure. The calculated half-life and 95% confidence interval for the decay of each transcript are listed. (C) Northern analysis of the decay of mRNAs encoding PGK1 and RPS6B (quantified with a PhosphorImager).
Figure 2
Figure 2
Comparison between overall mRNA decay rates and poly(A)+ mRNA decay rates. (A) Distribution of half-lives of mRNA overall decay (blue) and poly(A)+ mRNA decay (red). (B) Scatter plot of half-lives of mRNA overall decay and poly(A)+ mRNA decay for the 4,661 mRNAs. Cor. Coeff. = 0.50. The pink dashed line indicates a slope of 1. The green solid line is the best least-squares linear fit of the data, with a slope of 0.41 and y intercept of 1 min (in log scale).
Figure 3
Figure 3
mRNA encoding the subunits of stoichiometric protein complexes exhibit coordinated decay. (A) Examples of coordinated decay of transcripts for four stoichiometric protein complexes. The number of unique components in each complex is indicated in parentheses; decay curves for 40 randomly selected mRNAs, excluding five outliers (see Fig. 2D), encoding unique ribo some subunits are shown. (B) Clustering of the decay half-lives of mRNAs encoding subunits of protein complexes. The number of unique components in each complex is indicated in parentheses. Red open circles, half-lives of individual mRNAs within each complex; thick black bar, the mean half-life for each complex; error bars indicate ±1 SD. The complexes are sorted along the vertical axis (top to bottom) in the order of increasing mean half-lives. (C) Statistical test for the coordinated decay of subunits of stoichiometric protein complexes with N ≥ 2 components. A P value for the clustering of decay rates of transcripts for each physical complex of size of N was calculated. The probability of obtaining a smaller P value from random sampling (104 times) of N samples from 4,482 unique mRNA half-lives was then determined and summarized in the histogram. The dashed line represents the uniform distribution expected for the null hypothesis in which there is no coordination of decay rates. (D) A small set of mRNAs encoding ribosomal proteins has anomalously fast decay rates. Blue curve, average decay curve of 131 RP mRNAs; error bars indicate ±1 SD; green curves, decay curves of five individual mRNAs—RPS4A, RPS4B, RPL3, RPS27A, and RPS28B (average of triplicate measurements)—with very short half-lives (t1/2 < 10 min).
Figure 4
Figure 4
Coherence of mRNA turnover in physiological systems. The range of half-lives, from 0 to more than 45 min, was continuously color-coded with a green-yellow-red gradient (green = shortest half-lives, red = longest half-lives). For protein complexes with multiple subunits, smaller blocks were individually color-coded to represent the mRNA half-lives for each subunit. White boxes represent transcripts for which we did not obtain an adequate measurement of decay. TCA, tricarboxylic acid. mRNA turnover in (A) central energy metabolism systems (modified from ref. 17); (B) the pheromone signal transduction pathway (modified from ref. 43); and (C) translation factors.

References

    1. Hargrove J L, Schmidt F H. FASEB J. 1989;3:2360–2370. - PubMed
    1. Ross J. Microbiol Rev. 1995;59:423–450. - PMC - PubMed
    1. Cabrera C V, Lee J J, Ellison J W, Britten R J, Davidson E H. J Mol Biol. 1984;174:85–111. - PubMed
    1. Ross J. Trends Genet. 1996;12:171–175. - PubMed
    1. Casey J L, Hentze M W, Koeller D M, Caughman S W, Rouault T A, Klausner R D, Harford J B. Science. 1988;240:924–928. - PubMed

Publication types