. 2002 May;68(5):2344-52.
doi: 10.1128/AEM.68.5.2344-2352.2002.

Bacillus probiotics: spore germination in the gastrointestinal tract

Affiliations

Bacillus probiotics: spore germination in the gastrointestinal tract

Gabriella Casula et al. Appl Environ Microbiol. 2002 May.

Abstract

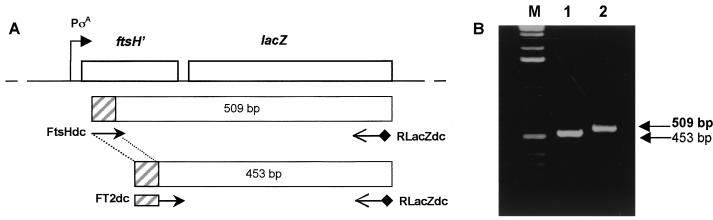
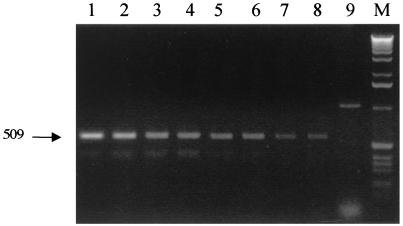
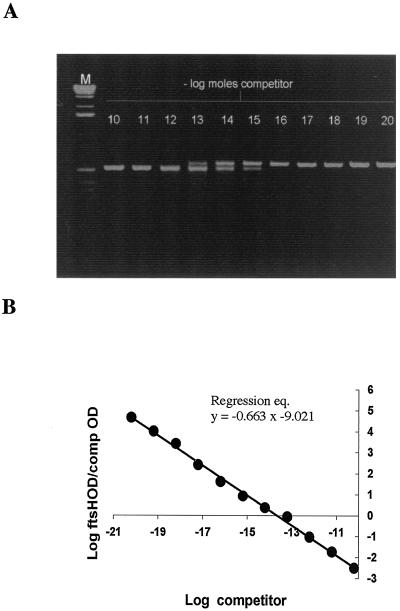
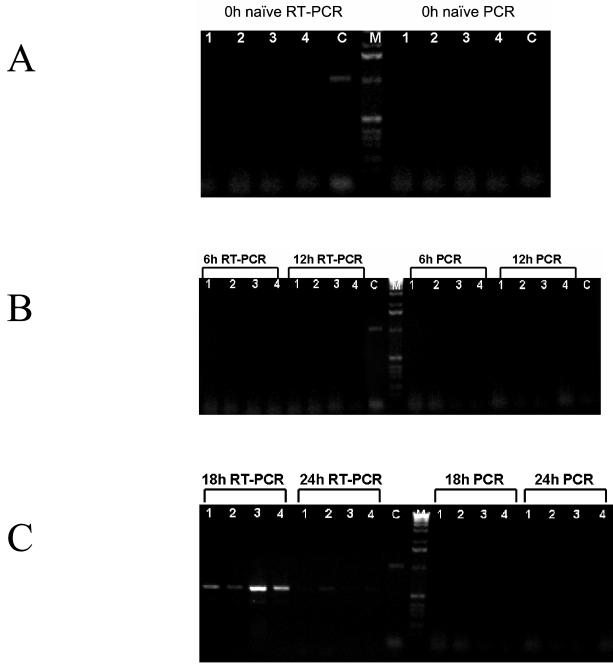
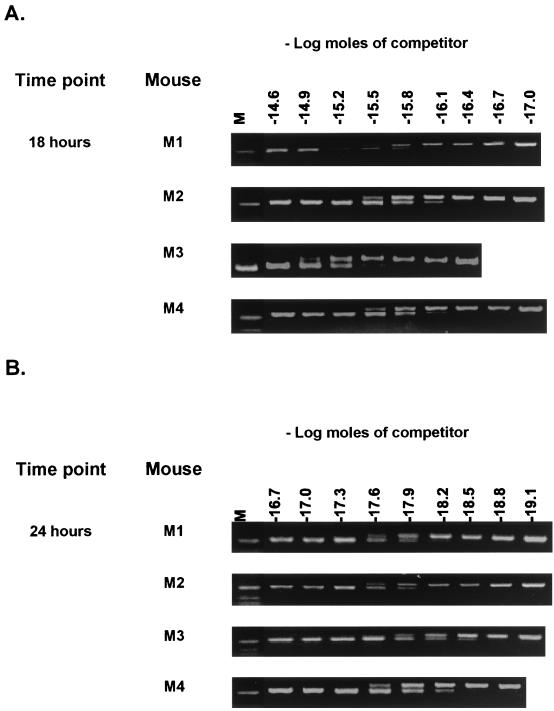
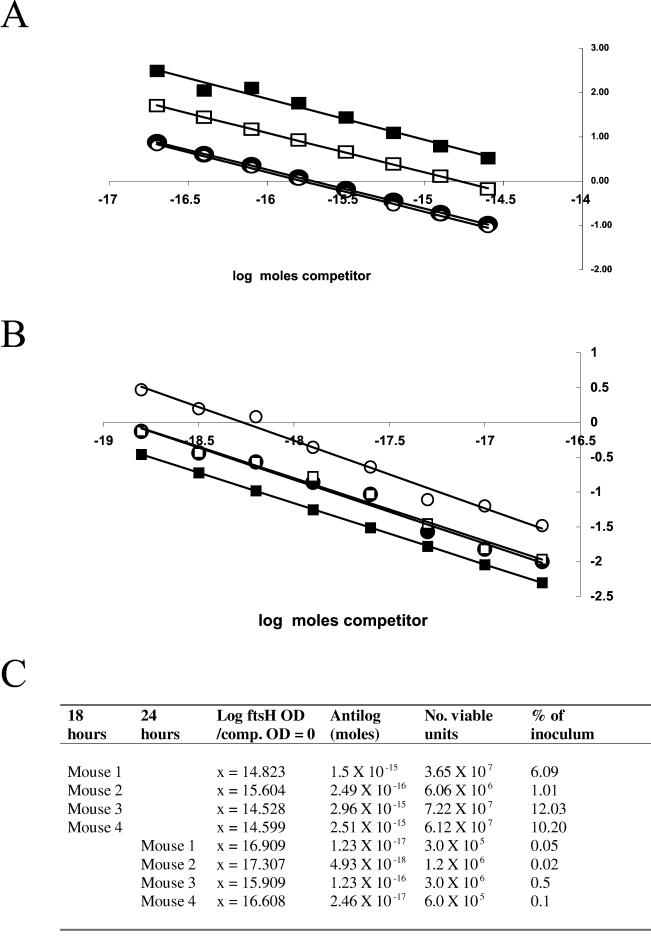
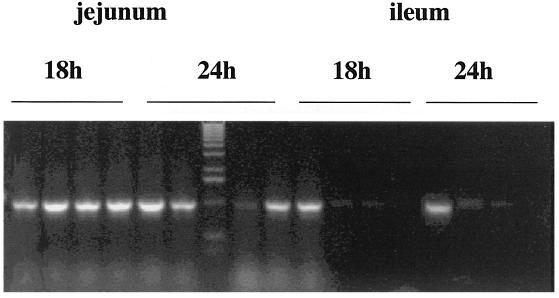
Spores of Bacillus species are being used commercially as probiotics and competitive exclusion agents. Unlike the more commonly used Lactobacillus-type probiotics, spores are dormant life forms. To address how spore probiotics might function we have investigated whether spores can germinate in the gastrointestinal tract by using a murine model. Using a genetically engineered chimeric gene, ftsH-lacZ, which is strongly expressed only in vegetative cells, we have developed a sensitive competitive reverse transcription-PCR assay which has enabled detection of as few as 10(2) vegetative bacteria in the mouse gut. Using this method we have administered doses of ftsH-lacZ spores to groups of mice and shown that spores can germinate in significant numbers in the jejunum and ileum. The levels of detection we obtained suggest that spores may colonize the small intestine, albeit briefly.


Figures

FIG. 1.
FIG. 1.
ftsH-lacZ chimera and PCR amplification products. (A) Physical map of the ftsH-lacZ chromosome of strain SC2288 as described by Lysenko et al. (17). The FtsHdc and RlacZdc primers used to amplify a 509-base segment across the ftsH-lacZ fusion junction and FT2dc and RlacZdc used to amplify a 453-base competitor template are shown together with the predicted amplification products. The hatched boxes indicate the sequence included in the 5′ end of the FT2dc primer that is recognized by the FtsHdc primer. (B) PCR amplifications with these primer sets using SC2288 chromosomal DNA. Lane M, 1-kb ladder.
FIG. 2.
FIG. 2.
Sensitivity of RT-PCRs. To approximate the sensitivity of the RT-PCR small intestine sections excised from a mouse were spiked with different amounts of vegetative cells of SC2288 (ftsH-lacZ) (see Materials and Methods). Total RNA (1 μg) was then prepared, and RT-PCR was performed using FtsHdc and RlacZdc to amplify the 509-base ftsH-lacZ product. A positive control was also used to spike mouse sections with MS2 phage and to amplify a 1,054-base MS2-specific RT-PCR product of 1,054 bases. Lane 1, 5 × 10⁷ SC2288 cells; lane 2, 1 × 10⁷ SC2288 cells; lane 3, 5 × 10⁶ SC2288 cells; lane 4, 1 × 10⁶ SC2288 cells; lane 5, 5 × 10⁵ SC2288 cells; lane 6, 1 × 10⁵ SC2288 cells; lane 7, 5 × 10⁴; lane 8, 1 × 10⁴ SC2288 cells; lane 9, MS2 phage (positive PCR control); lane M, 1-kb ladder.
FIG. 3.
FIG. 3.
Competitive RT-PCR assay. Determination of the number of moles of ftsH-lacZ mRNA using a competitive RT-PCR assay. Jejunum sections prepared from six mice were spiked with 6 × 10⁸ vegetative cells of SC2288, and total RNA was prepared. RT-PCR was used with two primers (FT2dc and RlacZdc) to generate a competitive template of 453 bases. This competitor template was purified, and dilutions were mixed with total RNA samples prepared from each mouse. These were then used in individual RT-PCRs using primers FtsHdc and RlacZdc to generate a 509-base product (from the RNA) and a 453-base product (from the competitor). (A) Representative titration from one mouse sample. As the concentration of competitor template decreases so the production of the 509-base product increases (left to right on the gel). Relative absorbance values from densitometric analysis of the 509- and 453-base PCR products were determined and normalized for size. (B) Least-squares regression analysis of average densitometric data from the group of six mice. The log moles of competitor RT-PCR product is plotted against the logarithmic ratio of absorbance of the 509-base species to absorbance of the 453-base product.
FIG. 4.
FIG. 4.
RT-PCR analysis of jejunum sections. Groups of four mice (lanes 1, 2, 3, and 4) were administered 6 × 10⁸ spores of strain SC2288. Mice were sacrificed at 6, 12, 18, and 24 h (B and C) and dissected, the jejunum was excised, and total RNA was extracted. (A) In addition naïve, untreated mice and mice just before dosing (0 h) were also examined. Total RNA was subjected to RT-PCR analysis using two primers (FtsHdc and RlacZdc) which generate a 509-base cDNA product if more than 104 SC2288 vegetative cells are present. Samples to the right of the 1-kb ladder are identical RT-PCRs in which the AMV reverse transcriptase has been inactivated by heat treatment. (C) Control RT-PCR using MS2 bacteriophage as supplied with the Calypso RT-PCR kit.
FIG. 5.
FIG. 5.
Competitive RT-PCR analysis. Total RNA extracts from 18 -h (A) and 24 -h (B) jejunum samples of mice dosed with SC2288 (ftsH-lacZ) cells were mixed with dilutions of a competitive template (as described in Materials and Methods and Fig. 3). Samples correspond to those of Fig. 4.
FIG. 6.
FIG. 6.
Quantitation of ftsH-lacZ transcripts. Densitometric analysis of the 453- and 509-base products from competitive RT-PCR assays shown in Fig. 5 were used for regression analysis. Shown are results of regression analysis of the 18-h jejunum samples for the four mice sampled (A) and the 24-h samples (B). (A) The equations for the regression lines relative to the 18-h samples were the following: mouse 1, y = −0.8833x − 13.093 (R2 = 0.99); mouse 2, y = −0.8961x − 13.982 (R2 = 0.99); mouse 3, y = −0.9286x − 13.491 (R2 = 0.98); mouse 4, y = −0.8897x − 12.989 (R2 = 0.99). (B) The equations for the regression lines for the 24-h samples were the following: mouse 1, y = −0.919x − 15.539 (R2= 0.98); mouse 2, y = −0.9712x − 17.820 (R2= 0.98); mouse 3, y = −0.8786x − 118.107 (R2 = 1); mouse 4, y = −0.9008x − 18.437 (R2 = 0.98). (C) Tabulation of the quantification of vegetative bacteria (viable units) using the extrapolated regression data.
FIG. 7.
FIG. 7.
RT-PCR analysis using rrnO-lacZ. Groups of four mice were administered 6 × 10⁸ spores of strain SL6913. Mice were sacrificed at 18 and 24 h and dissected, the jejunum and ileum were excised, and total RNA was extracted. Total RNA was subjected to RT-PCR analysis using two primers which generate a 1-kb cDNA product when SL6913 vegetative cells are present.

References

    1. Angert, E. R., and R. M. Losick. 1998. Propagation by sporulation in the guinea pig symbiont Metabacterium polyspora. Proc. Natl. Acad. Sci. USA 95:10218-10223. - PMC - PubMed
    1. Atlas, R. M. 1999. Probiotics: snake oil for the new millenium? Environ. Microbiol. 1:375-382. - PubMed
    1. Caruso, A., G. Flamminio, S. Folghera, L. Peroni, I. Foresti, A. Balsari, and A. Turano. 1993. Expression of activation markers on peripheral-blood lymphocytes following oral administration of Bacillus subtilis spores. Int. J. Immunopharmacol. 15:87-92. - PubMed
    1. Chomczynski, P., and N. Sacchi. 1987. Single step method of RNA isolation by acid guanidinium thiocyanate-phenol-chloroform extraction. Anal. Biochem. 162:156-159. - PubMed
    1. Ciprandi, G., A. Scordamaglia, D. Venuti, M. Caria, and G. W. Canonica. 1986. In vitro effects of Bacillus subtilis on the immune response. Chemioterapia 5:404-407. - PubMed

Publication types

LinkOut - more resources