. 2002 May;136(1):9-22.
doi: 10.1038/sj.bjp.0704671.

Molecular and pharmacological characterization of genes encoding urotensin-II peptides and their cognate G-protein-coupled receptors from the mouse and monkey

Affiliations

Molecular and pharmacological characterization of genes encoding urotensin-II peptides and their cognate G-protein-coupled receptors from the mouse and monkey

Nabil A Elshourbagy et al. Br J Pharmacol. 2002 May.

Abstract

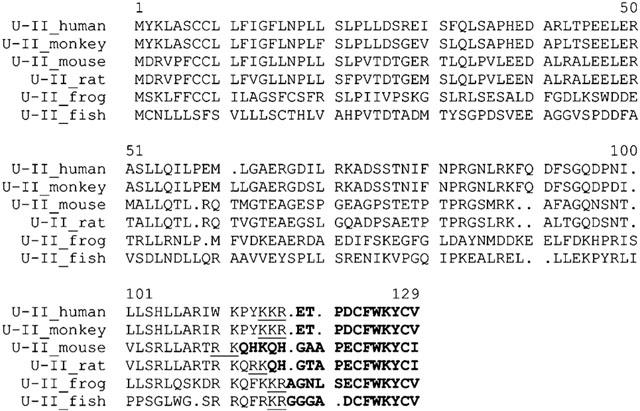
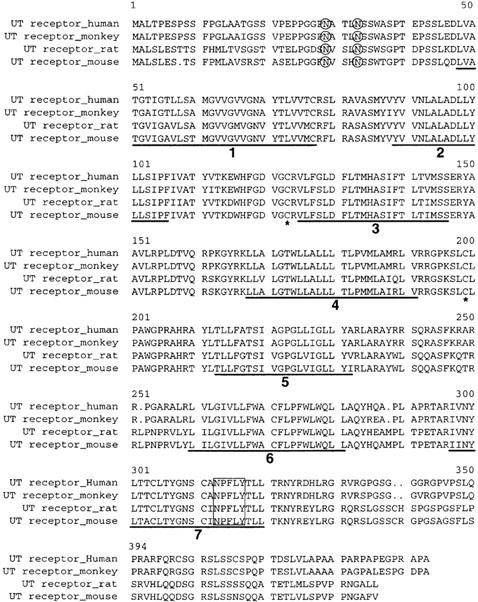
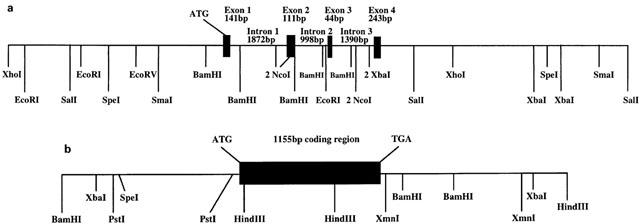
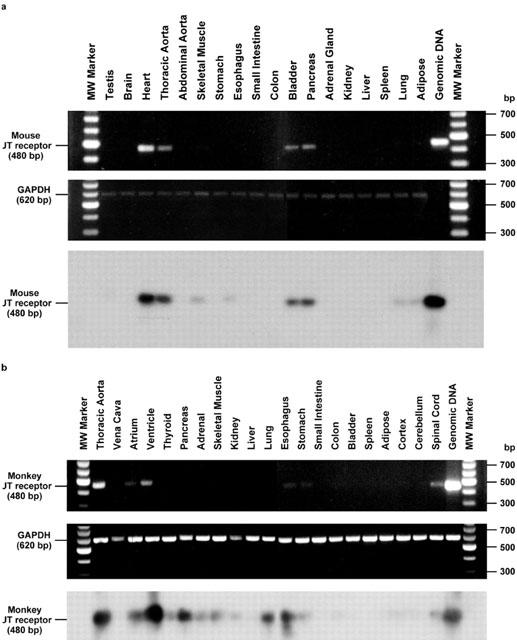
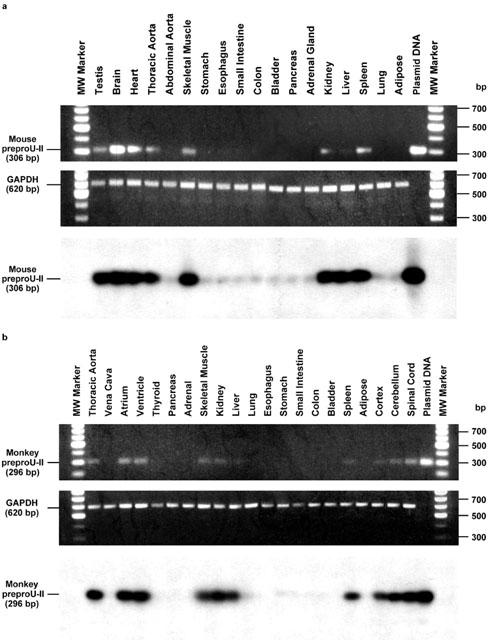
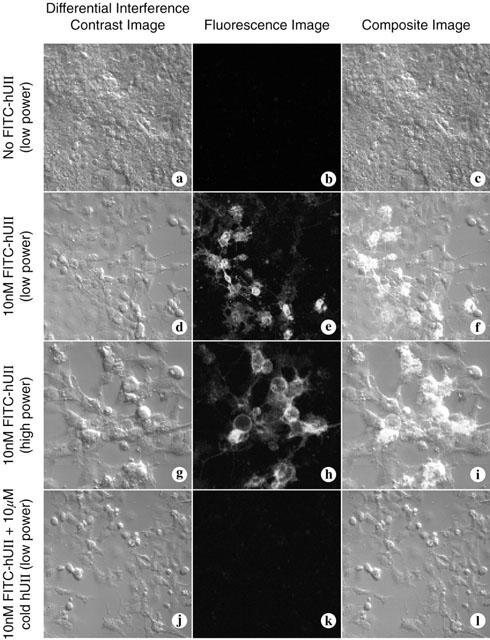
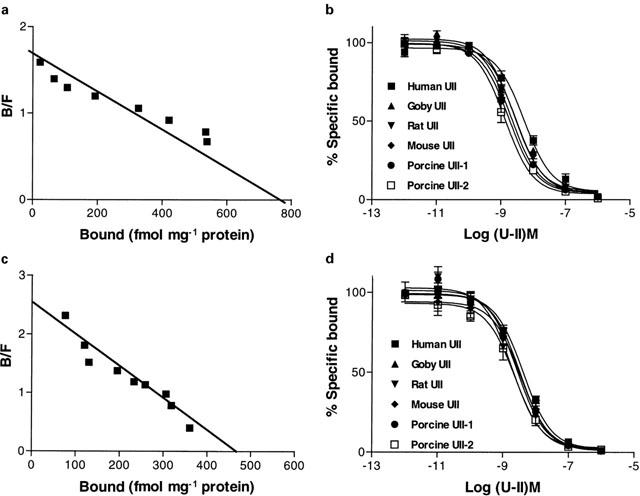
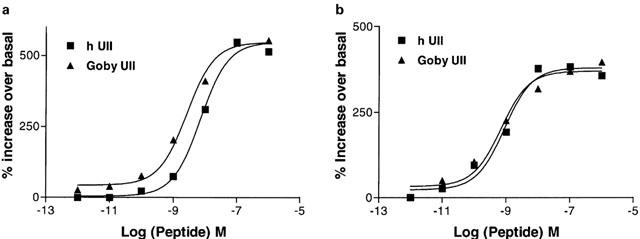
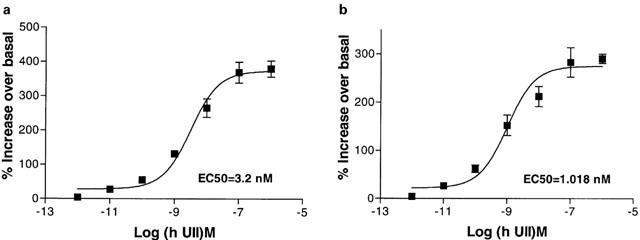
Urotensin-II (U-II) and its receptor (UT) represent novel therapeutic targets for management of a variety of cardiovascular diseases. To test such hypothesis, it will be necessary to develop experimental animal models for the manipulation of U-II/UT receptor system. The goal of this study was to clone mouse and primate preproU-II and UT for pharmacological profiling. Monkey and mouse preproU-II genes were identified to encode 123 and 125 amino acids. Monkey and mouse UT receptors were 389, and 386 amino acids, respectively. Genomic organization of mouse genes showed that the preproU-II has four exons, while the UT receptor has one exon. Although initially viewed by many exclusively as cardiovascular targets, the present study demonstrates expression of mouse and monkey U-II/UT receptor mRNA in extra-vascular tissue including lung, pancreas, skeletal muscle, kidney and liver. Ligand binding studies showed that [125I]h U-II bound to a single sites to the cloned receptors in a saturable/high affinity manner (Kd 654+/-154 and 214+/-65 pM and Bmax of 1011+/-125 and 497+/-68 fmol mg-1 for mouse and monkey UT receptors, respectively). Competition binding analysis demonstrated equipotent, high affinity binding of numerous mammalian, amphibian and piscine U-II isopeptides to these receptors (Ki=0.8 - 3 nM). Fluorescein isothiocyanate (FITC) labelled U-II, bound specifically to HEK-293 cells expressing mouse or monkey UT receptor, confirming cell surface expression of recombinant UT receptor. Exposure of these cells to human U-II resulted in an increase in intracellular [Ca2+] concentrations (EC50 3.2+/-0.8 and 1.1+/-0.3 nM for mouse and monkey UT receptors, respectively) and inositol phosphate (Ip) formation (EC50 7.2+/-1.8 and 0.9+/-0.2 nM for mouse and monkey UT receptors, respectively) consistent with the primary signalling pathway for UT receptor involving phospholipase C activation.


Figures

Figure 1
Figure 1
Amino acid sequence alignments of the human, monkey, mouse, rat, frog, and fish preproU-II. The potential cleavage sites of the proU-II is underlined. The mature U-II peptide is highlighted.
Figure 2
Figure 2
Amino acid sequences alignments of the human, monkey, mouse and rat UT. Deduced amino acid residues are indicated beginning with the initiation methionine. The regions identifying the positive transmembrane as domains 1 – 7 are underlined and numbered sequentially. The potential N-glycosolation site (O), the conserved cysteins (*), and the potential palmytalation site (boxed), are indicated. The optimal alignment of the deduced amino acid sequences of the mouse and monkey UT receptor were compared to the rat and human UT receptor using the Wisconsin program obtained from Devereux et al. (1984).
Figure 3
Figure 3
Genomic structure of the mouse U-II and its receptor. Mouse U-II and UT receptor BAC clones were isolated as described in Methods. Restriction fragments containing U-II or UT receptor genomic sequence were isolated and subcloned into pBluescript II, and used to generate restriction maps of the loci which were determined by sequence analysis. (a) Restriction map of the genomic structure. Note that for NcoI, BamHI, and SpeI only the sites, which have been confirmed by sequence analysis, are indicated. The restriction map upstream of exon I and downstream of exon 4 shows approximately site locations as determined by restriction digest of genomic subclones. (b) Restriction map of the genomic structure of UT receptor indicating one coding exon.
Figure 4
Figure 4
Tissue distribution of the mouse and monkey UT receptor: (a) Tissue distribution of mouse UT receptor cDNA transcripts by RT – PCR revealed expression within cardiac and vascular (thoracic but not abdominal aorta) tissue in addition to bladder and pancreas. Trace levels of expression are also observed in skeletal muscle, oesophagus, lung and adipose tissue. (Middle panel) Amplification of GAPDH cDNA did not differ significantly between tissues. The specificity of the RT – PCR amplification of UT receptor transcripts was confirmed (Lower panel) by Southern analysis using full-length UT receptor cDNA probe. (b) Tissue distributions of monkey UT receptor cDNA transcripts by RT – PCR revealed expression within heart (ventricle>atrium) and arterial blood vessels (aorta not vena cava), pancreas. Detectable levels of expression were also observed in the skeletal muscle, lung, thyroid and adrenal glands, kidney, upper portions of the gastrointestinal tract (oesophagus, stomach and small intestine but not colonic tissue) and spinal cord (but not in the cortical or cerebellar samples isolated). No detectable transcripts were derived from hepatic, bladder, adipose tissue or splenic tissue. (Middle panel) Amplification of GAPDH cDNA did not differ significantly between tissues. The specificity of the RT – PCR amplification of UT receptor transcripts was confirmed (lower panel) by Southern analysis using full-length UT receptor cDNA probe.
Figure 5
Figure 5
Tissue distribution of the mouse and monkey U-II. (a): Tissue distribution of mouse preproU-II cDNA transcripts by RT – PCR revealed expression within heart, thoracic aorta, testes, brain, skeletal muscle, liver, kidney and spleen (upper panel). Negligible expression of preproU-II was observed in the mouse gastrointestinal tract (stomach, oesophagus, small intestine and colon), bladder, pancreas, adrenal, lung and adipose tissue. Amplification of GAPDH cDNA did not differ significantly between tissues (middle panel). The specificity of the RT – PCR amplification of preproU-II transcripts was confirmed by Southern analysis using full-length preproU-II cDNA probe (lower panel). (b) Tissue distribution of monkey preproU-II cDNA transcripts by RT – PCR revealed expression within heart (ventricle and atrium), thoracic aorta, CNS (spinal cord, cerebellum and cortex), skeletal muscle, kidney, liver and spleen (upper panel). No detectable transcripts were derived from vena cava, endocrine tissues including thyroid, pancreas and adrenal glands, lung, gastrointestinal tissue (oesophagus, stomach, small intestine, colon), bladder or adipose tissue. Amplification of GAPDH cDNA did not differ significantly between tissues (middle panel). The specificity of the RT – PCR amplification of preproU-II transcripts was confirmed by Southern analysis using full-length preproU-II cDNA probe (lower panel).
Figure 6
Figure 6
Binding of FITC-labelled human U-II to COS-cells transfected with mouse and monkey UT receptor. FITC-labelled human U-II (10 nM) does not bind to control COS-1 cells ‘mock' transfected with empty vector (panels a – c). Binding is evident at the plasma membrane of cells transfected with mouse UT receptor (two different fields of view either at original magnification of 20× or 40×, panels d – f and g – i, respectively). FITC- human U-II binding to the cell surface of COS-1 cells expressing mouse UT receptor is inhibited by the presence of 1000 fold excess ligand (10 μM cold human U-II; panels j – l). In each set of three images, differential interference contrast (DIC) images appear on the left, fluorescence images are in the centre, and computer-generated composites of the DIC and fluorescence image are on the right.
Figure 7
Figure 7
[125I]-U-II binding to HEK-293 cells transfected with mouse and monkey UT receptor cDNAs: Scatchard plots of [125I] h- U-II saturation binding to cell membranes from HEK-293 cells stably transfected with mouse (a) or monkey (c) UT receptor. Membranes (10 – 15 μg) were incubated with increasing concentrations of [125I] human U – II (0.02 – 0.6 nM) in a total volume of 150 μl at 25°C for 45 min and assayed as described in Methods. Competition binding curves for iso U-II peptides (human, goby, rat, mouse, porcine-1 and porcine-2) of mouse (b) or monkey (d) UT receptor (respectively). Membranes (10 – 15 μg) were incubated with 0.18 nM [125I] human U-II for 45 min at 25°C in the presence of increasing concentrations of U-II isopeptides. Data are the means of duplicate determinations and are representative results from one of three independent experiments. Ki values for pooled data are shown in Table 2.
Figure 8
Figure 8
U-II-mediated inositol phosphates accumulation: Inositol phosphates accumulation in response to human and goby U-II (1 pM – 1 μM) in HEK-293 cells stably transfected with mouse (a) or monkey (b) UT receptor. The cells were treated with myo-[3H]inositol (1.0 μCi ml−1) overnight and then washed to remove excess myo-[3H]inositol. The cells were challenged with different concentrations of human or goby U-II for 5 min, and the inositol phosphates were separated from free inositol using ion-exchange chromatography. Data are the mean±s.e.mean values from three different experiments for the accumulation of inositol trisphosphate. Similar observation was made for inositol mono and diphosphates.
Figure 9
Figure 9
U-II-mediated [Ca2+]i release. Concentration-response curve for human U-II-mediated [Ca2+]i increase in mouse (a) or monkey (b) UT receptor stably transfected in HEK-293 cells. Each point represents the mean±s.e.mean from three separate experiments.

References

    1. AIYAR N., BAKER E., WU H.L., NAMBI P., EDWARDS R.M., TRILL J.J., ELLIS C., BERGSMA D.J. Human AT1 receptor is a single copy gene: characterization in a stable cell line. Mol. Cell Biochem. 1994;131:75–86. - PubMed
    1. AIYAR N.V., NAMBI P., STASSEN F.L., CROOKE S.T. Vascular vasopressin receptors mediate phosphatidylinositol turnover and calcium efflux in an established smooth muscle cell line. Life Sciences. 1986;39:37–45. - PubMed
    1. AMES R.S., SARAU H.M., CHAMBERS J.K., WILLETTE R.N., AIYAR N.V., ROMANIC A.M., LOUDEN C.S., FOLEY J.J., SAUERMELCH C.F., COATNEY R.W., AO Z., DISA J., HOLMES S.D., STADEL J.M., MARTIN J.D., LIU W.S., GLOVER G.I., WILSON S., MCNULTY D.E., ELLIS C.E., ELSHOURBAGY N.A., SHABON U., TRILL J.J., HAY D.W., OHLSTEIN E.H., BERGSMA D.J., DOUGLAS S.A. Human urotensin-II is a potent vasoconstrictor and agonist for the orphan receptor GPR14. Nature. 1999;401:282–286. - PubMed
    1. BERN H.A., LEDERIS K. A reference preparation for the study of active substances in the caudal neurosecretory system of teleosts. J. Endocrinol. 1969;45:xi–xii. - PubMed
    1. BERN H.A., PEARSON D., LARSON B.A., NISHIOKA R.S. Neurohormones from fish tails: the caudal neurosecretory system. I. ‘Urophysiology' and the caudal neurosecretory system of fishes. Rec. Prog. Horm. Res. 1985;41:533–552. - PubMed

MeSH terms