. 2002 May 1;22(9):3392-403.
doi: 10.1523/JNEUROSCI.22-09-03392.2002.

Functional stoichiometry of glutamate receptor desensitization

Affiliations

Functional stoichiometry of glutamate receptor desensitization

Derek Bowie et al. J Neurosci. .

Abstract

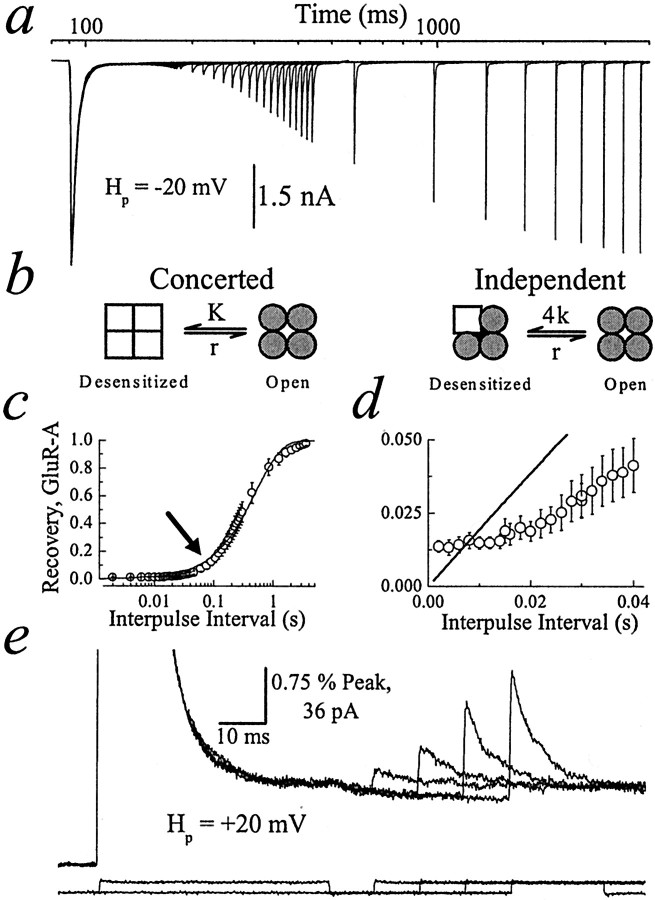
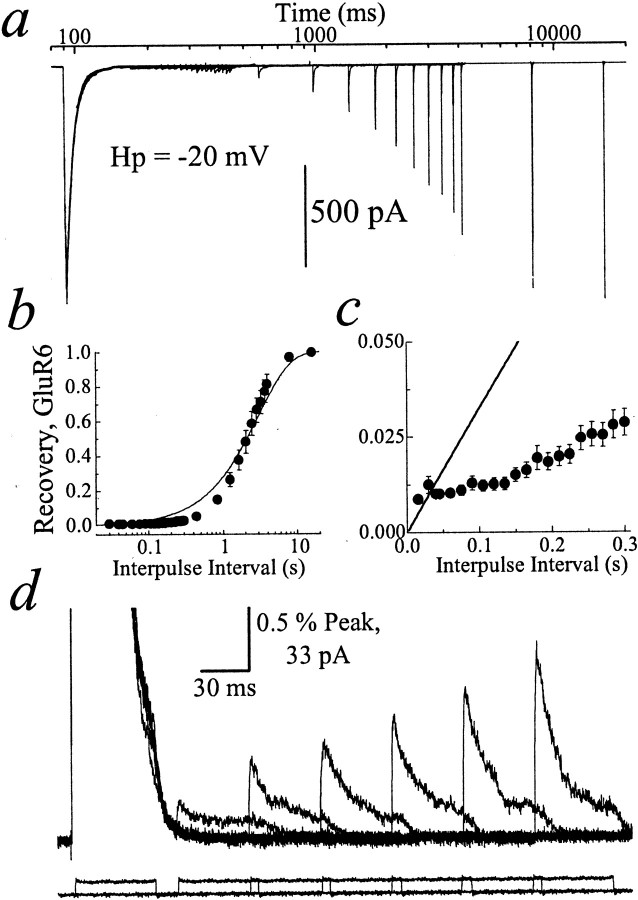
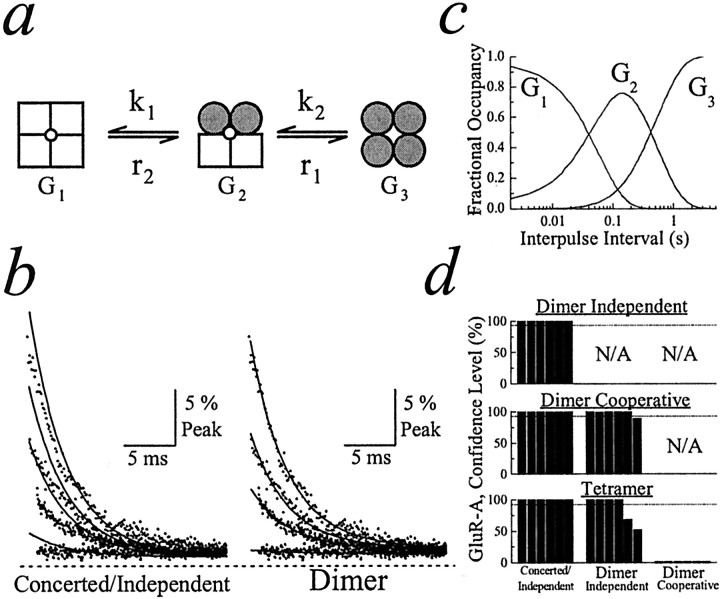
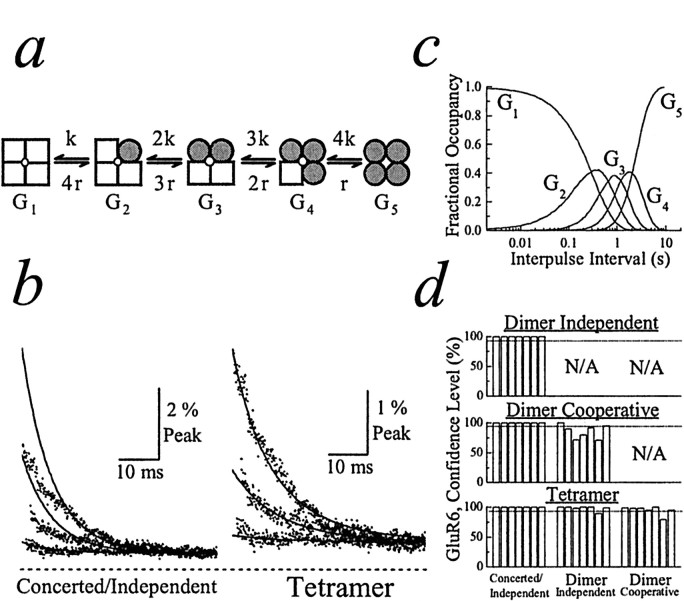
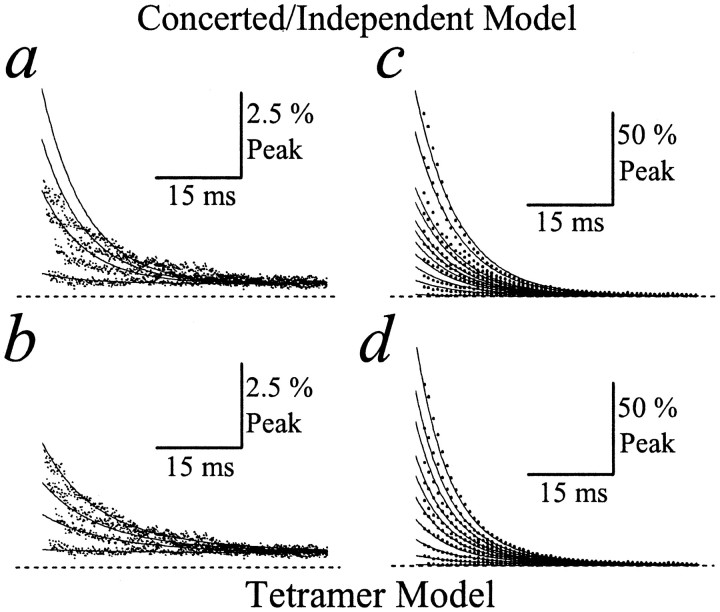
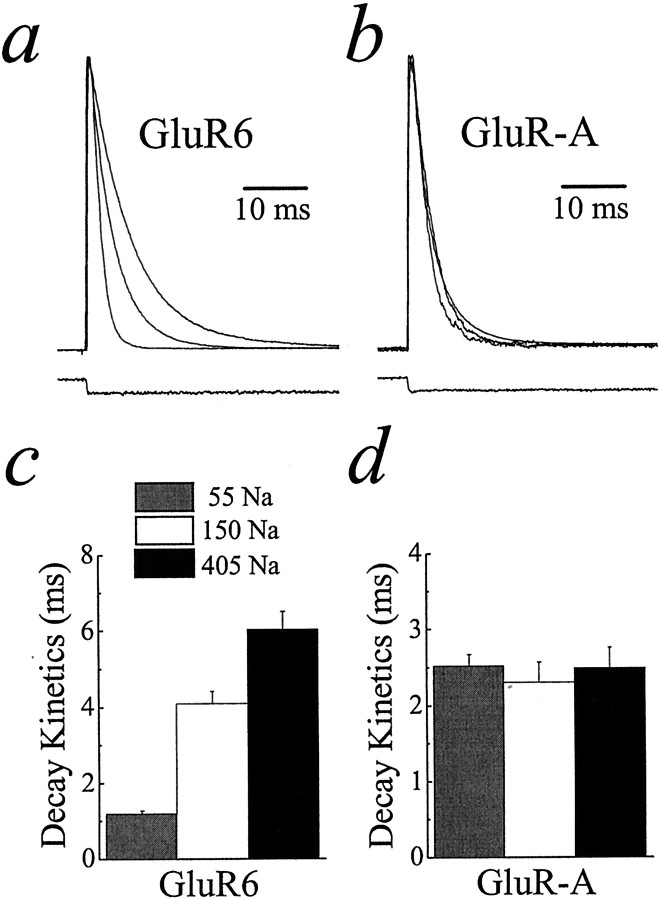
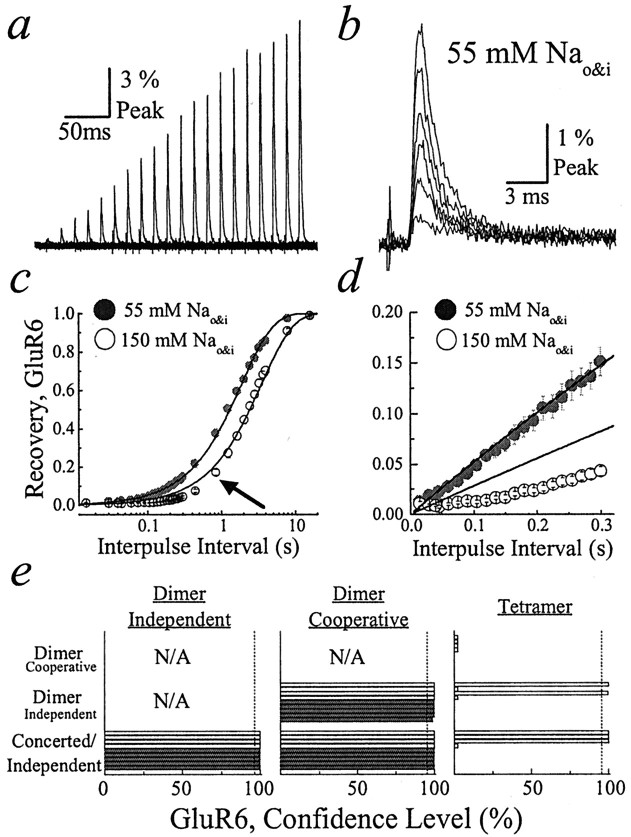
Potassium (K+) channels and ionotropic glutamate receptors (iGluRs) fulfill divergent roles in vertebrate nervous systems. Despite this, however, recent work suggests that these ion channels are structurally homologous, sharing an ancestral protein, architectural design, and tetrameric subunit stoichiometry. Their gating mechanisms also are speculated to have overlapping features. Here we show that the mechanism of iGluR desensitization is unique. Unlike K+ channels, AMPA- and kainate-type iGluR subunits desensitize in several ordered conformational steps. AMPA receptors operate as dimers, whereas the functional stoichiometry of kainate receptor desensitization is dependent on external ions. Contrary to conventional understanding, kinetic models suggest that partially desensitized AMPA and kainate receptors conduct ions and are likely participants in synaptic signaling. Although sharing many structural correlates with K+ channels, iGluRs have evolved unique subunit-subunit interactions, tailoring their gating behavior to fulfill distinct roles in neuronal signaling.


Figures

Fig. 1.
Fig. 1.
Entry into and exit from AMPA receptor desensitization. a, Typical recording showing 50 superimposed conditioning and test pulses (10 mm; 50 msec duration; Hp, −20 mV); patch number 010123p3. b, Schematic of concerted (left) and independent (right) models of desensitization highlights the behavior of individual subunits.c, Summary plot of GluR-A recovery in 405 mmNaCl solution (n = 6; mean ± SEM). Data were fit (solid line) by the expression:I(t) = Ipeak· [1− Exp(−trec)], whereI(t) is the response amplitude at any time,t, Ipeak is the peak test response, and τrec, the time constant for recovery, is 508 ± 12 msec. The arrow denotes a section of recovery plot not well fit by a single exponential function.d, Concerted/independent models do not fit the data well, particularly during the early recovery phase. e, Same patch as a (Hp, +20 mV) showing four test pulses separated by 10 msec increments.Bottom traces show junction currents to monitor the solution exchange.
Fig. 2.
Fig. 2.
Entry into and exit from kainate receptor desensitization. a, Typical recording showing 33 superimposed conditioning and test Glu pulses (10 mm; 50 msec duration; Hp, −20 mV); patch number 000720p2. b, Summary plot of GluR6 recovery in 405 mm NaCl solution (n = 7; mean ± SEM). Data were fit (solid line) by the expression:I(t) = Ipeak· [1 − Exp(−trec)], where τrec was 3.02 ± 0.14 sec. c, Concerted/independent models do not fit the data adequately, particularly at brief intervals. d, Profile of six test pulses separated by 45 msec increments (patch number 000721p1;Hp, +20 mV). Bottom traces show junction currents recorded with an open electrode tip.
Fig. 3.
Fig. 3.
Determining the functional stoichiometry of AMPA receptor desensitization. a, Schematic of the cooperative dimer model. b, GluR-A experimental records (dots; patch number 010123p1) fit with the concerted/independent models (left, solid line) and the cooperative dimer model (right,solid line). The first 25 msec of four test responses [time after conditioning response (tc) was 8, 40, 60, and 105 msec] were superimposed for comparison. The dashedline indicates zero current level. c, Plot profiling the distribution of each state in the cooperative dimer model at a range of interpulse intervals. d, Summary plots showing how fits of experimental data with different models of desensitization were compared. Fits were compared pairwise, using theF ratio test. Top plot shows the independent dimer compared with the concerted/independent models.Middle plot compares the cooperative dimer with concerted/independent models and independent dimer model. Bottom plot compares the tetramer model with all other models of desensitization. Each bar indicates the confidence level distinguishing between two models fit to the same experimental data. For every comparison six bars are shown that represent the results from six separate patch recordings. The dashed line in each plot denotes the 95% confidence level.
Fig. 4.
Fig. 4.
Determining the functional stoichiometry of kainate receptor desensitization. a, Schematic of the tetramer model. b, GluR6 experimental records (dots; patch number 000720p2) fit with the concerted/independent (left, solid line) and tetramer (right, solid line) models. Entire 50 msec of three test responses (tc = 15, 135, and 285 msec) are superimposed for comparison. The dashed line indicates zero current level. c, Plot profiling the distribution of each state in the tetramer model at a range of interpulse intervals.d, Summary plots showing how fits of experimental data with different models of desensitization were compared. Fits were compared pairwise, using the F ratio test. Eachbar indicates the confidence level distinguishing between two models fit to the same experimental data. For every comparison seven bars are shown that represent the results from seven separate patch recordings. The dashed line in each plot denotes the 95% confidence level.
Fig. 5.
Fig. 5.
Kainate receptor desensitization fit with concerted/independent and tetramer models. a, b, Four superimposed test responses (tc = 15, 150, 225, and 300 msec; dots; patch number 000720p2) recorded during the early phase of recovery from GluR6 desensitization and fit with the concerted/independent model (a) or tetramer model (b). The dashed line indicates zero current level. Note that the tetramer model fits the data better than the concerted/independent model. c, d, Ten superimposed test responses from the same patch recording (tc = 0.040, 0.84, 1.24, 1.64, 2.04, 2.44, 2.84, 3.64, 7.95, and 15.95 sec; patch number 000720p2) showing both early and late phases of recovery from GluR6 desensitization and fit with the concerted/independent model (c) or the tetramer model (d). Note that the tetramer model fits the data better than the concerted/independent model. For clarity, the total number of data points on each test response sweep has been reduced (eightfold). The dashed line indicates zero current level.
Fig. 6.
Fig. 6.
Kainate receptor desensitization is modulated by external ions. a, b, Plots showing typical GluR6 or GluR-A receptor responses in symmetrical solutions of 55, 150, and 405 mm NaCl. Bottom traces show junction currents recorded with an open electrode tip. c, d, Summary plots illustrating the effect of changing the NaCl concentration on the time course of GluR6 and GluR-A receptor desensitization. Data are expressed as mean ± SEM.
Fig. 7.
Fig. 7.
External ions regulate the functional stoichiometry of kainate receptor desensitization. a, Typical GluR6 test responses recorded in 55 mm NaCl solutions exhibited similar decay kinetics (patch number 000724p2).b, When the first six test responses froma were aligned for comparison, the decay kinetics was revealed to be almost identical. c, Recovery from GluR6 desensitization in 55 (filled circles) and 150 (open circles) mm NaCl solutions. GluR6 recovery in 55 mm NaCl was monoexponential, where τrec was 1.88 ± 0.02 sec (n = 5), whereas recovery in 150 mm NaCl was not monoexponential, particularly at brief interpulse intervals (arrow; τrec = 3.48 ± 0.09 sec;n = 20). d, A closer examination of the plots in c shows that GluR6 responses in 55 mm NaCl recovered monoexponentially even at brief interpulse intervals, whereas responses in 150 mm NaCl clearly deviated from first-order behavior. e, Summary showing three plots in which the goodness of fit of the experimental data with different models of desensitization was compared. Goodness of fit was compared pairwise, using the F ratio test. Thefilled (n = 5) and open horizontal bars (n = 4) refer to experiments performed in symmetrical solutions of 55 and 150 mm NaCl, respectively. The dashed vertical line in each plot denotes the 95% confidence level.

References

    1. Armstrong N, Gouaux E. Mechanisms for activation and antagonism of an AMPA-sensitive glutamate receptor: crystal structures of the GluR2 ligand binding core. Neuron. 2000;28:165–181. - PubMed
    1. Armstrong N, Sun Y, Chen G-Q, Gouaux E. Structure of a glutamate receptor ligand-binding core in complex with kainate. Nature. 1998;395:913–917. - PubMed
    1. Ayalon G, Stern-Bach Y. Functional assembly of AMPA and kainate receptors is mediated by several discrete protein–protein interactions. Neuron. 2001;31:103–113. - PubMed
    1. Baukrowitz T, Yellen G. Modulation of K+ current by frequency and external [K+]: a tale of two inactivation mechanisms. Neuron. 1995;15:951–960. - PubMed
    1. Bowie D. External anions and cations distinguish between AMPA and kainate receptor gating mechanisms. J Physiol (Lond) 2002;539:725–733. - PMC - PubMed

Publication types

MeSH terms

LinkOut - more resources