. 2002 May 1;22(9):3594-607.
doi: 10.1523/JNEUROSCI.22-09-03594.2002.

Increased neurogenesis in adult mCD24-deficient mice

Affiliations

Increased neurogenesis in adult mCD24-deficient mice

Richard Belvindrah et al. J Neurosci. .

Abstract

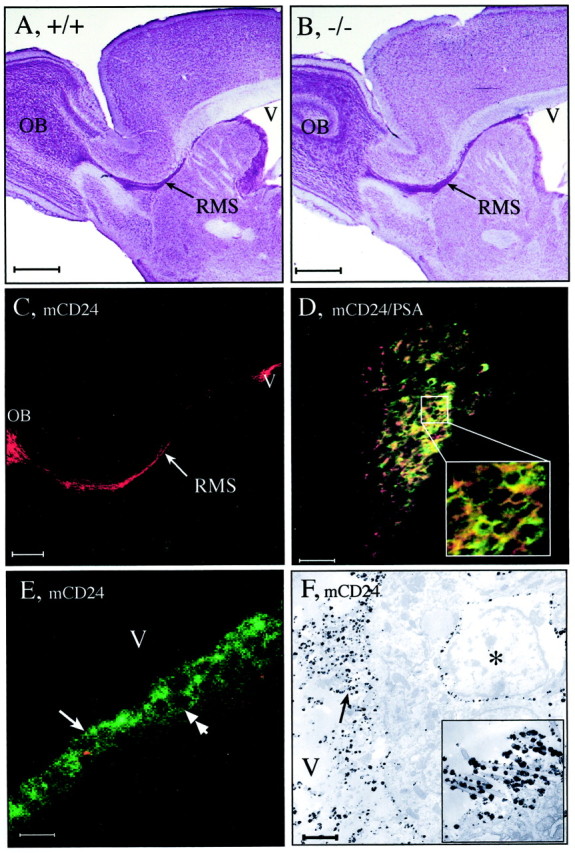
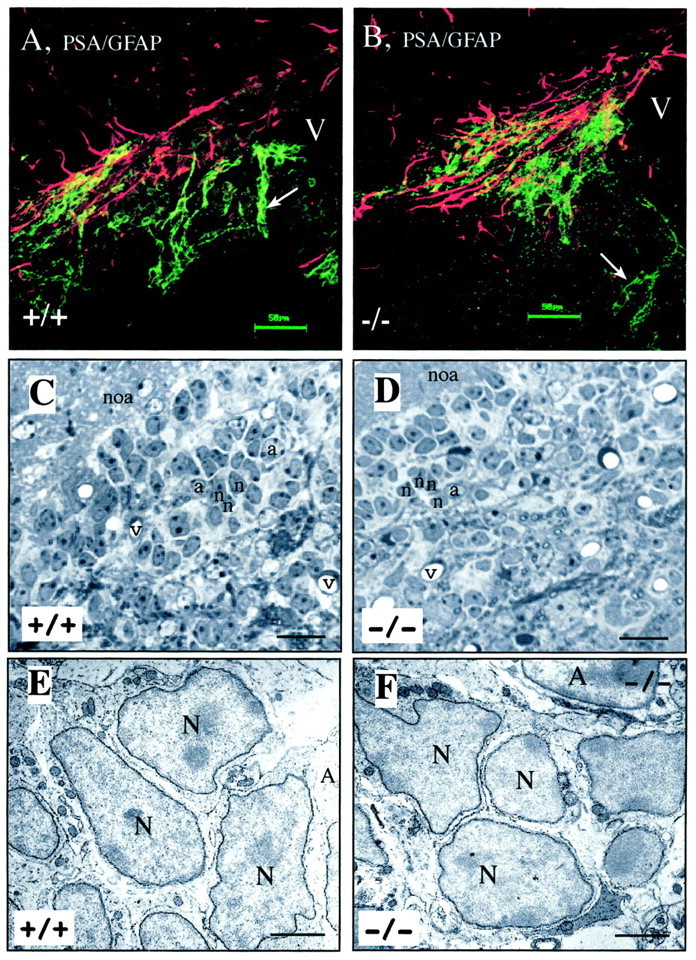
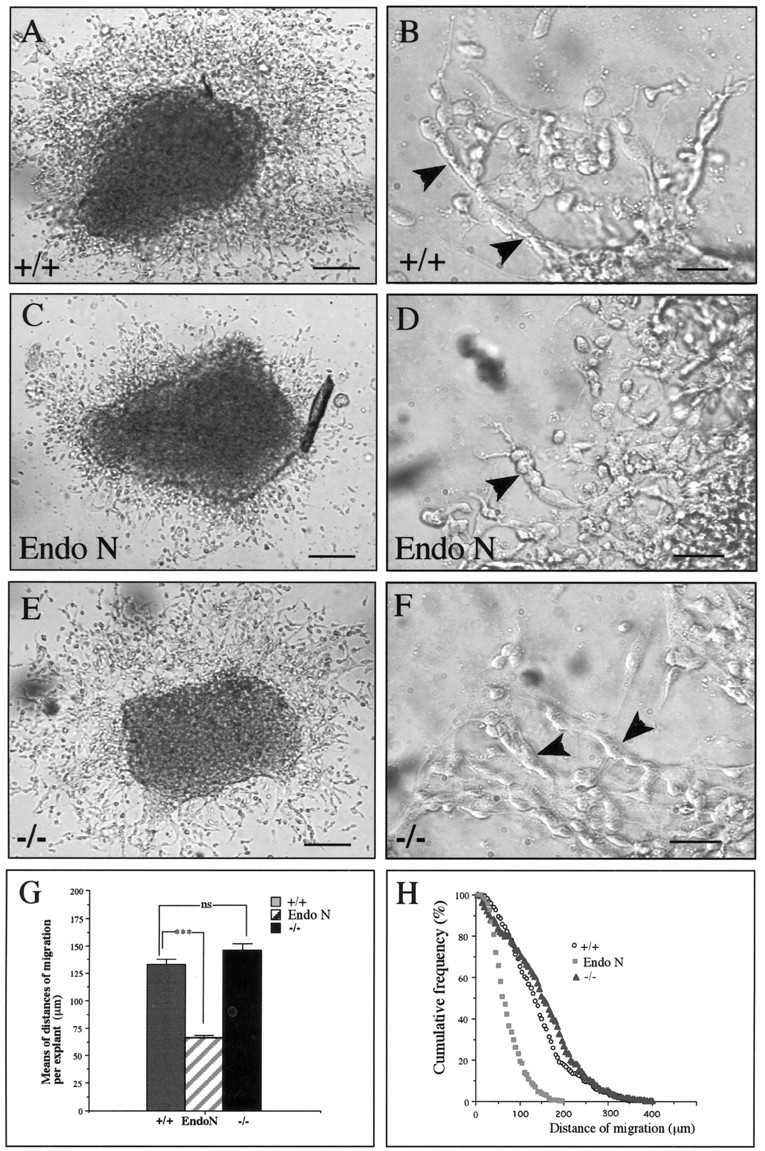
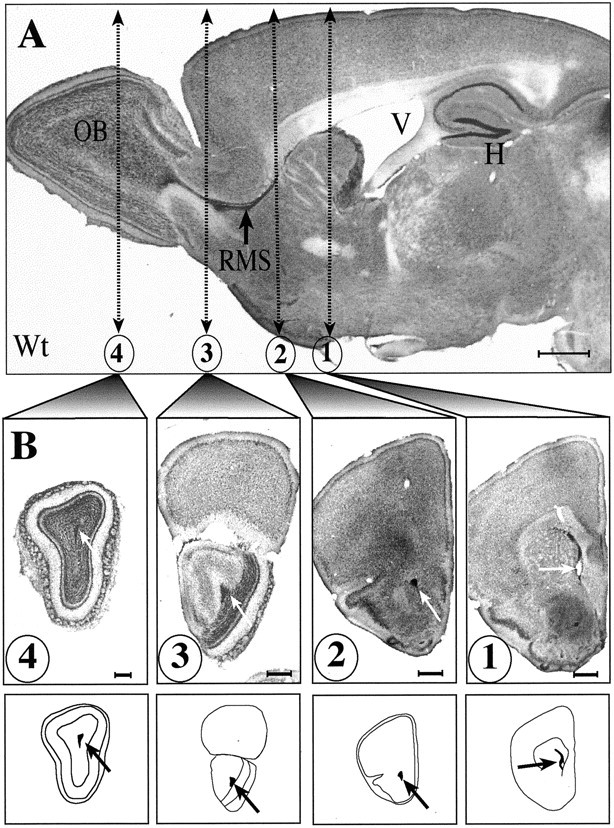
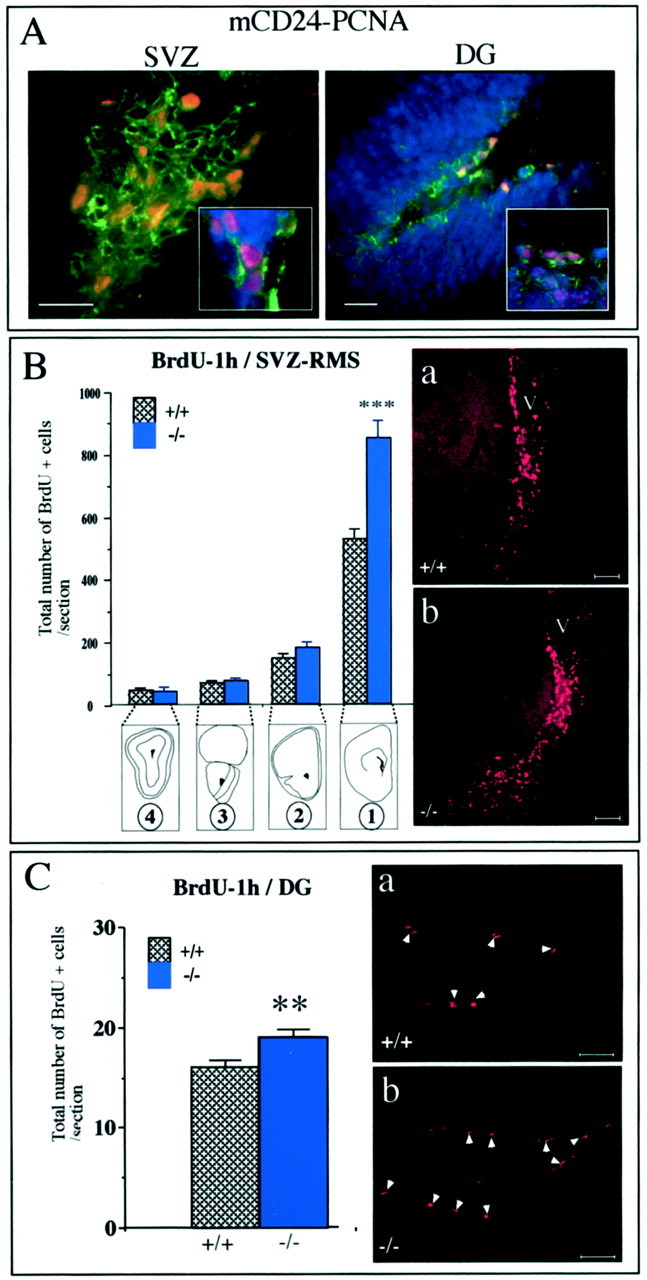
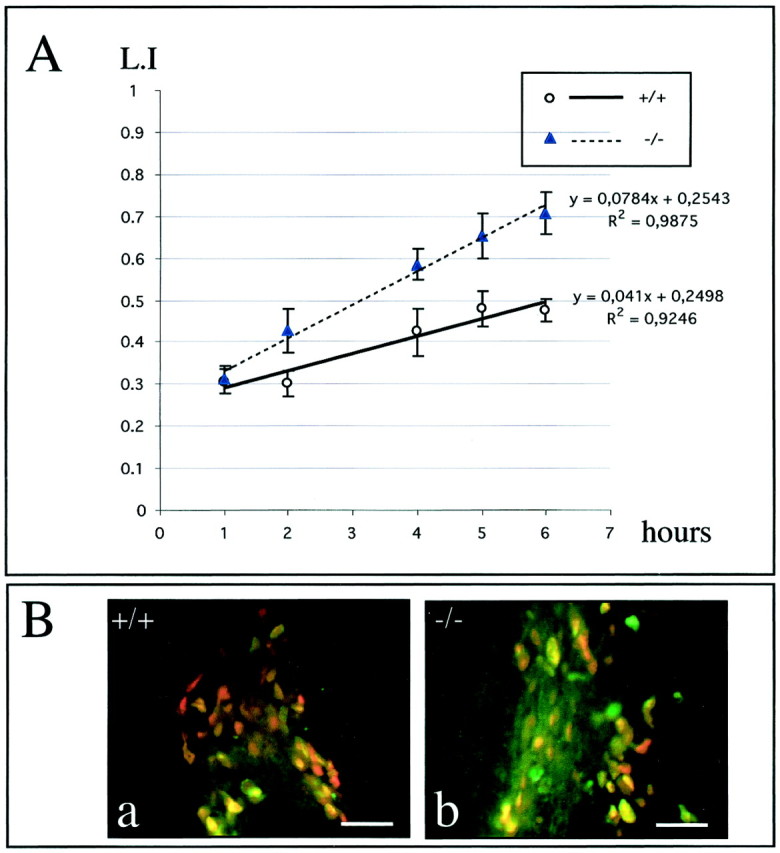
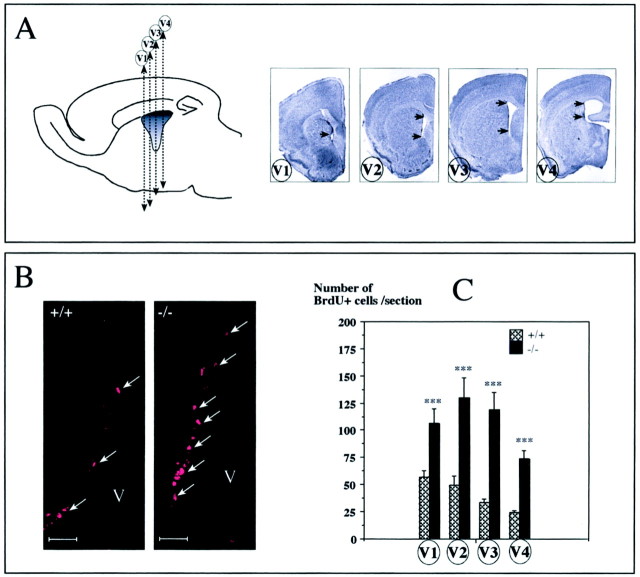
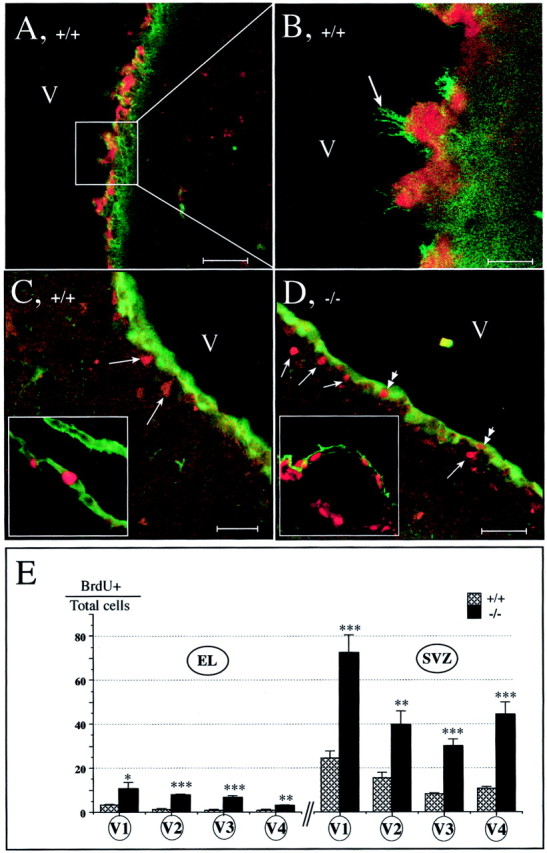
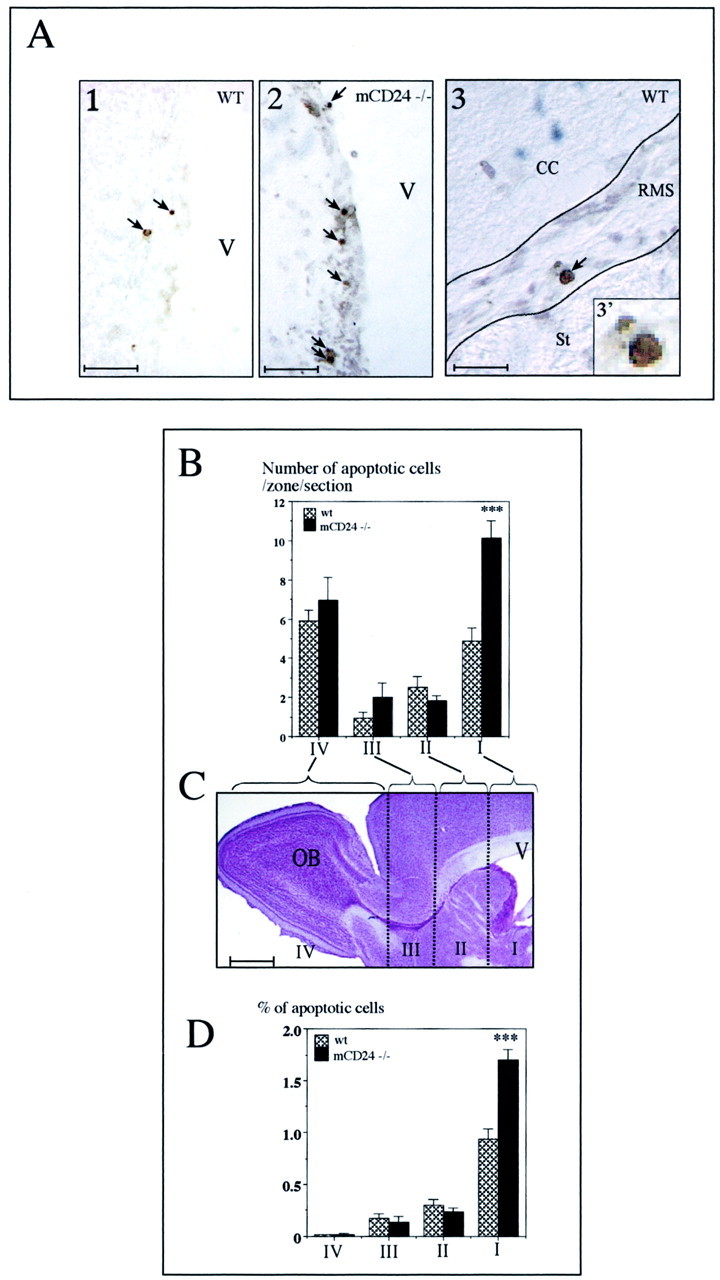
mCD24, a glycosylphosphatidylinositol-anchored highly glycosylated molecule, is expressed on differentiating neurons during development. In the adult CNS, its expression is restricted to immature neurons located in two regions showing ongoing neurogenesis: the subventricular zone (SVZ) of the lateral ventricle pathway and the dentate gyrus (DG) of the hippocampal formation. Here, combining bromodeoxyuridine (BrdU) and proliferating cell nuclear antigen labelings we confirmed that mCD24 is expressed on proliferating cells. To determine whether the inactivation of the molecule may affect adult neurogenesis, we analyzed the phenotype of mCD24-deficient mice (mCD24-/-). We labeled cells in S-phase with a pulse, a long, or a cumulative administration of BrdU and analyzed cells in different zones according to their dividing rate (rapid and slow) both in the control and mCD24-/-. We found a significant increase in the number of rapid (in the SVZ and the DG) and slow (in the SVZ) proliferating cells. Cumulative assays revealed a global reduction of the total cell cycle duration of rapidly proliferating precursors of SVZ. We investigated the fate of supernumerary cells and observed an increased number of apoptotic cells (terminal deoxynucleotidyl transferase-mediated biotinylated UTP nick end labeling) in the mutant SVZ. Furthermore, we found no difference in the size of the olfactory bulb between wild-type (WT) and mutant mice. In support, mCD24 deletion did not appear to affect migration in the migratory stream. A comparison of the organization of migrating precursors between WT and mCD24 -/-, both in vivo at the optic and electron microscopic levels and in SVZ cultured explants, did not show any changes in the arrangement of neuroblasts in chain-like structures. Altogether, our data suggest that mCD24 regulates negatively cell proliferation in zones of secondary neurogenesis.


Figures

Fig. 1.
Fig. 1.
Localization of the RMS in the adult WT (A, +/+) and mCD24−/− mice (B, −/−). In sagittal sections from a Nissl stain preparation, the RMS of the WT appears as a continuous pathway connecting the anterior horn of the lateral ventricle (V) to the center of the olfactory bulb (OB). In the mCD24−/−, the pathway has the same location and shape (B). There is no distortion or increase in size of the ventricle. Expression of mCD24 in the WT RMS (C, D); mCD24 (red) is expressed on migrating cells all along the pathway (arrow) from the ventricle (V) to the olfactory bulb (OB) and is primarily coexpressed with PSA-NCAM (D) (green). This can be clearly seen on the square in D, representing an enlargement of the core of the RMS. Expression of mCD24 is on ventricular zones (E, F). Confocal microscopy (E) reveals that mCD24 labeling is expressed on the membrane of ciliated ependymal cells lining the lateral ventricle (arrow). In addition, mCD24 is also expressed on the membrane of precursor cells present in the SVZ (double arrow). At the EM level (F), silver-enhanced gold particles reveal the mCD24 labeling on the membrane of microvilli and cilia of these cells (arrow) (insert: enlargement of cilia labeled with gold particles). In the SVZ, we can localize mCD24 on the membrane of some type A cells (asterisk). Scale bars: A, B, 1 mm; C, 500 μm;D, E, 50 μm; F, 1 μm.
Fig. 2.
Fig. 2.
Neuroblast-astrocyte organization at the optical and EM levels is conserved in mCD24−/− mice. Double immunofluorescence for PSA-NCAM and GFAP in the RMS of the WT and mCD24 −/− mice (A, B). Confocal laser imaging revealed in the WT (A, +/+) and mutant (B, −/−) mice the same arrangement between neuroblasts and glial cells. In both groups, the expression of PSA-NCAM clearly shows chain-like arrangement of neuronal precursors (arrows) migrating inside tangential glial structures. C, At the EM level, in frontal section, the RMS appears as a highly organized structure containing groups of neuronal precursors (n) surrounded by astrocytes (a). D,The mutant RMS showed the same organization. At higher magnification (E +/+, F −/−), there is no sign of disorganization with neuroblasts (N) still grouped together and ensheated by astrocytes (A).v, Vessels, noa, nucleus olfactorius anterior. Scale bars: A, B, 50 μm; C, D, 20 μm; E, F, 3 μm.
Fig. 3.
Fig. 3.
Comparison of the cell migration of WT and mCD24 −/− SVZ explants cultured in Matrigel. Explants were cultured from the SVZ of WT (A) or mCD24 −/− mice (E). Explants from WT were also cultured in presence of Endoneuraminidase N (Endo N) as a positive control (C) (Chazal et al., 2000). Cells migrate outside the explant as a regular network in WT (A). At higher magnification we can see the migrating cells organized in chains (B, arrowheads). In presence of EndoN (positive control), we clearly observed a reduction in size of the network (C) with a decrease in the length of the chains (D, arrowhead). In the explant from the mCD24−/− SVZ (E), the network of cells outside the explant is similar to the WT and the cells are still organized in chains (see higher magnification in F, arrowheads). The results of the means of migration per explant are summarized in the diagram in G, demonstrating no difference in the distance of migration between WT and mCD24−/− explants. H, Cumulative frequency distribution plot of the distance of cell migration following the different types of explant. For the WT and mCD24−/− explants, the slopes of the respective curve are similar, indicating the same distance of migration for both groups (***p < 0.001). Scale bars:A, C, E, 100 μm; B, D,F, 20 μm.
Fig. 4.
Fig. 4.
Light micrographs of sagittal and frontal sections from Nissl stain preparation illustrating the position of the RMS and hippocampal formation (H). The RMS is clearly identifiable in sagittal (A) but also in frontal sections (B, arrows). The four frontal sections illustrated and schematized below were selected for statistical analysis. Scale bars: A, B, 500 μm.
Fig. 5.
Fig. 5.
Increased number of BrdU+ cells in the mutant SVZ and DG. A, In the SVZ and DG, mCD24 (green) was present on proliferating cells labeled with the PCNA marker (red). Cells were counterstained with the nuclear marker Hoechst (blue).B, In the WT and mCD24−/− mice, BrdU+ cells were present all along the RMS. We quantified the number of these cells in the four frontal levels selected (B1–4). An increased number of BrdU+ cells was detected only at level 1 (SVZ) in the mCD24−/− mice. No significant difference in the number of BrdU+ cells between WT and mutant was observed in the other levels (***p < 0.001 compared with WT). Example of this increased number of BrdU+ cells in the SVZ in the WT (a) and mCD24−/− (b) mice. C, In the WT and mCD24−/− hippocampal formation, BrdU+ cells were visible only in the subgranular zone of the DG. Labeled cells spanning the entire extent of the DG were counted. A significant increase of BrdU+ cells, expressed as a total number of BrdU+ cells per section, were detected in the DG of the mutant mice (**p < 0.01 compared with WT). Scale bars:A, 30 μm; Ba,b–Ca,b, 50 μm.
Fig. 6.
Fig. 6.
Comparison of the cell-cycle length in the WT and mCD24 −/− mice. A, Graphic representation of the LI of the population of cycling cells (i.e., the percentage of PCNA+ cells that have incorporated BrdU) in the WT and mCD24−/− mice. Values are ± SEM. ANOVA statistical analysis showed significant different slopes of linear regression for both groups, indicating different cell-cycle length. B, Example of an increased number of double-labeled cells BrdU+ (green)/PCNA+ (red) in the mutant SVZ at 6 hr of cumulative BrdU, reflecting an increased LI. Scale bars:Ba,b, 25 μm.
Fig. 7.
Fig. 7.
Increased number of BrdU+ cells in the SVZ of the mCD24−/− mice after a pulse-chase protocol. A, The lateral ventricle was cut in frontal serial sections as shown in the diagram. For the quantification, we selected four frontal levels (V1–V4) and counted the BrdU+ cells in the areas delineated byarrows. B, Examples of BrdU+ cells (arrows) in the SVZ of the WT and mCD24−/− mice. We can clearly notice an increase in BrdU+ cells in the mutant mice.C, Quantification of the proliferation expressed as an absolute number of BrdU+ cells per level revealed a significant increase in the number of BrdU+ cells in the mutant mice in the four levels selected (V1–V4) (***p < 0.001 compared with WT). Scale bars, 50 μm.
Fig. 8.
Fig. 8.
Slowly dividing cells are increased in both ependymal layer and SVZ in mCD24−/− mice. A, Cells lining the lateral ventricle (V) have their cytoplasm S100+ (red) and the membrane of their cilium labeled with mCD24 (green). Cells located in the SVZ are S100− but mCD24+ (see enlargement in B).C, In WT mice, double labeling S100 (green) and BrdU (red) revealed that most of the slowly dividing cells are in the SVZ (arrows) and in a very few cases in the ependymal layer (see inset). D, In mCD24−/− mice, BrdU+ nuclei (red) are localized, in majority, in the SVZ (single arrows). We can also observe S100+/BrdU+ cells in the ependymal layer (double arrows) (inset, mechanical separation of the ependyme from SVZ clearly showed this increase of the double-labeled cells in the mCD24−/− ependymal layer). E, Differential quantification of slowly dividing cells in the ependymal layer (EL): even if the basal slow proliferation level is low in WT mice, it is significantly increased in the four selected ventricular levels in the mCD24−/− mice. In the SVZ, the percentage of slow proliferating cells is higher than those of the EL and in the four levels selected they are highest in the mCD24−/− mice; the anterior part of the SVZ presents the highest proportion of BrdU+ cells (*p < 0.05; **p < 0.01; ***p < 0.001). Scale bars: A, D, 50 μm; B, 10 μm; C, 30 μm.
Fig. 9.
Fig. 9.
Increased apoptotic cells in the migratory pathway of the mCD24−/− mice. A1, A2, Examples of apoptotic nuclei (dark dots, arrows) revealed by the TUNEL technique in the SVZ of the lateral ventricle of the WT and mCD24−/− mice. A3, Apoptotic nuclei (arrow) in the RMS of WT mice (the enlargement in 3′ shows the condensed nucleus of the cell). For the quantification of apoptotic cells in the WT and mutant mice, the migratory pathway on each sagittal section was divided into four zones (I–IV), as represented in C. B, In the WT and mutant mice, apoptotic cells were present in the four zones. However, in the mutant a higher number of dying cells was counted in zone I. This result was confirmed when we quantified the percentage of apoptotic cells (D). There was a twofold increase of programmed cell death in the SVZ of mutant mice (***p < 0.001 compare with WT). Scale bars:A1, A2, 100 μm; A3, 50 μm;C, 1 mm.

References

    1. Aigner S, Sthoeger ZM, Fogel M, Weber E, Zarn J, Ruppert M, Zeller Y, Vestweber D, Stahel R, Sammar M, Altevogt P. CD24, a murin-type glycoprotein, is a ligand for P-selectin on human tumor cells. Blood. 1997;89:3385–3395. - PubMed
    1. Altman J. Autoradiographic and histological studies of postnatal neurogenesis. 3. Dating the time of production and onset of differentiation of cerebellar microneurons in rats. J Comp Neurol. 1969;136:269–293. - PubMed
    1. Altman J, Das GD. Post-natal origin of microneurons in the rat brain. Nature. 1965;207:953–956. - PubMed
    1. Amoureux MC, Cunningham BA, Edelman GM, Crossin KL. N-CAM binding inhibits the proliferation of hippocampal progenitor cells and promotes their differentiation to a neuronal phenotype. J Neurosci. 2000;20:3631–3640. - PMC - PubMed
    1. Biebl M, Cooper CM, Winkler J, Kuhn HG. Analysis of neurogenesis and programmed cell death reveals a self-renewing capacity in the adult rat brain. Neurosci Lett. 2000;291:17–20. - PubMed

Publication types

MeSH terms