. 2002 Apr 29;157(3):357-66.
doi: 10.1083/jcb.200109045. Epub 2002 Apr 29.

Human Speedy: a novel cell cycle regulator that enhances proliferation through activation of Cdk2

Affiliations

Human Speedy: a novel cell cycle regulator that enhances proliferation through activation of Cdk2

Lisa A Porter et al. J Cell Biol. .

Abstract

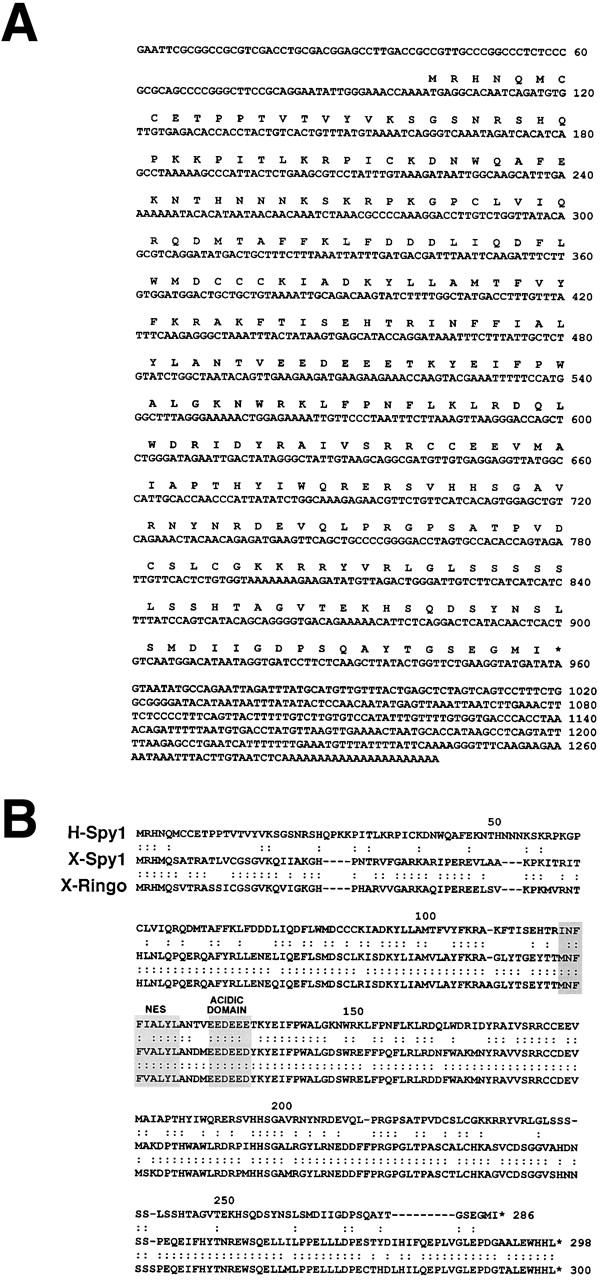
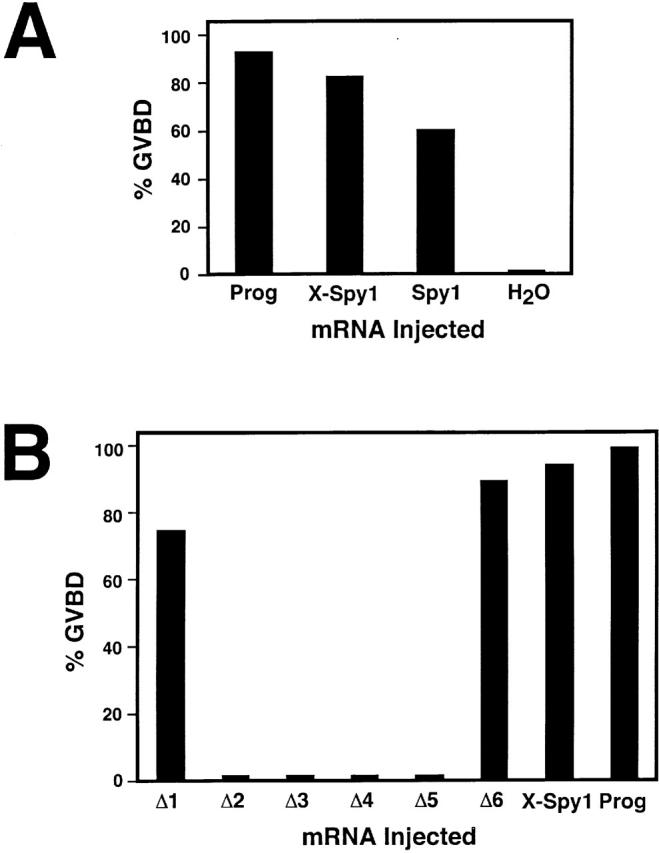
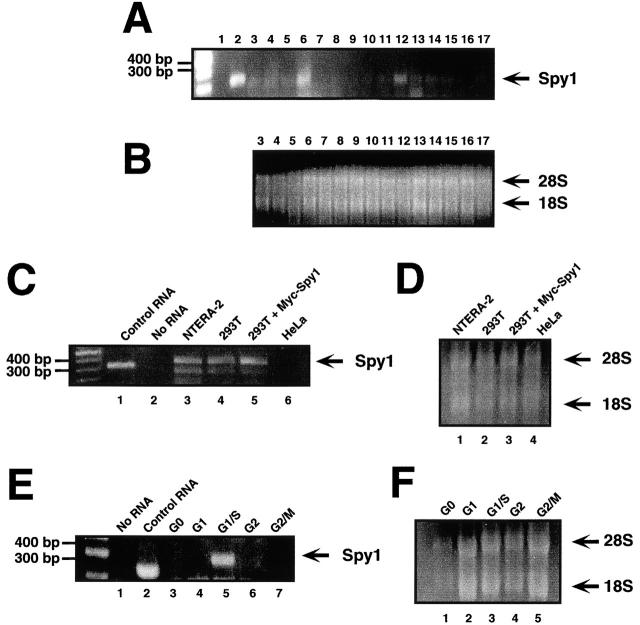
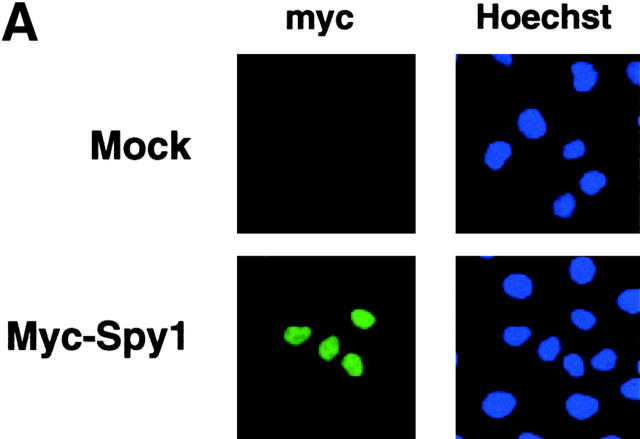
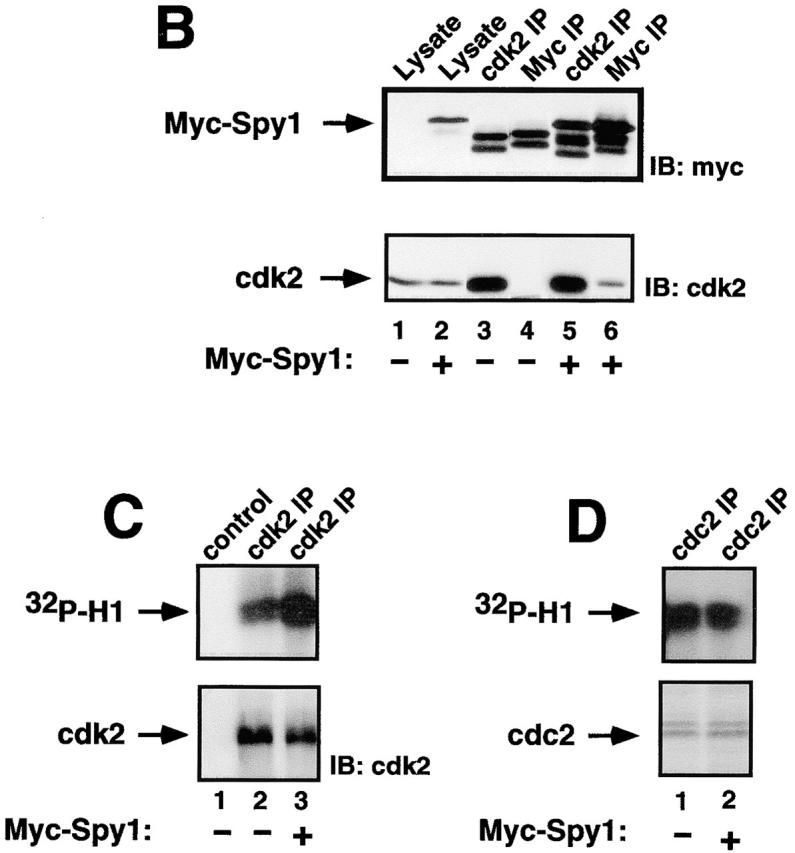
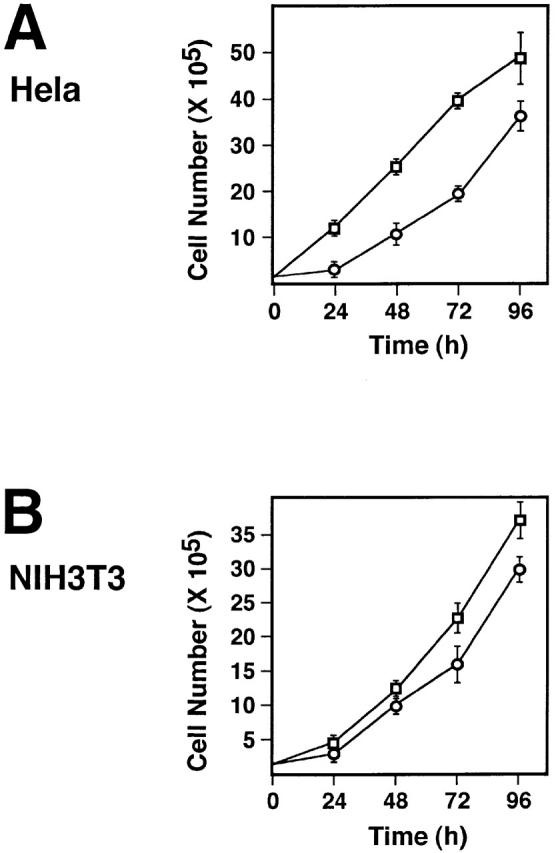
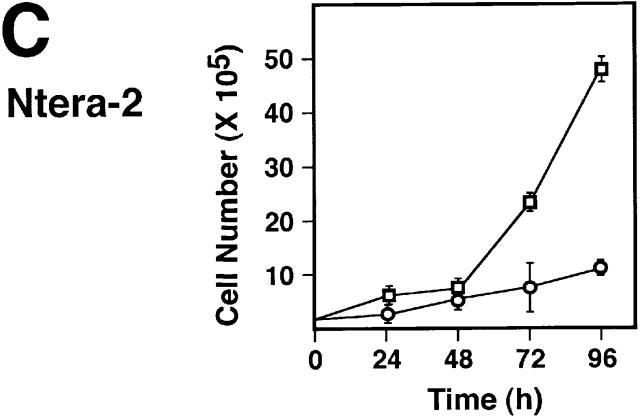
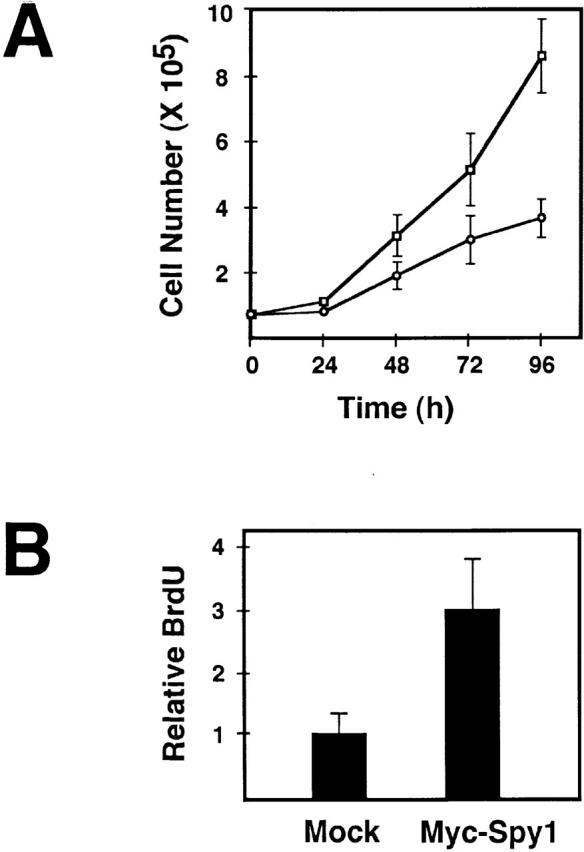
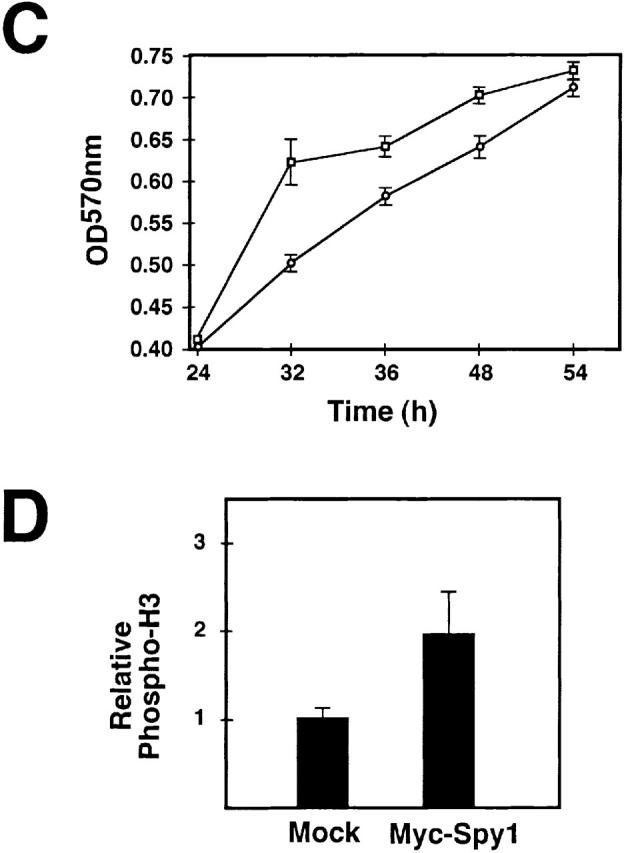
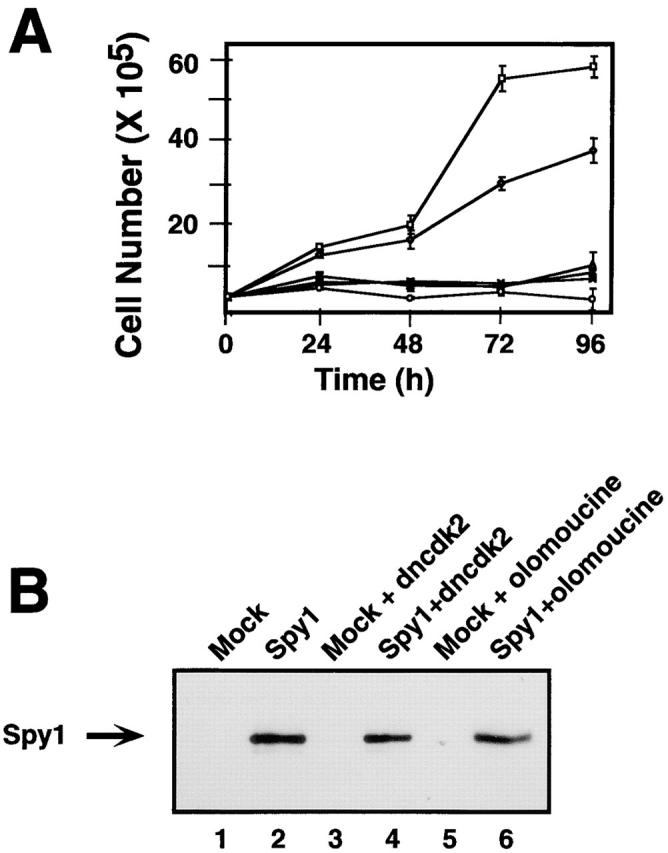
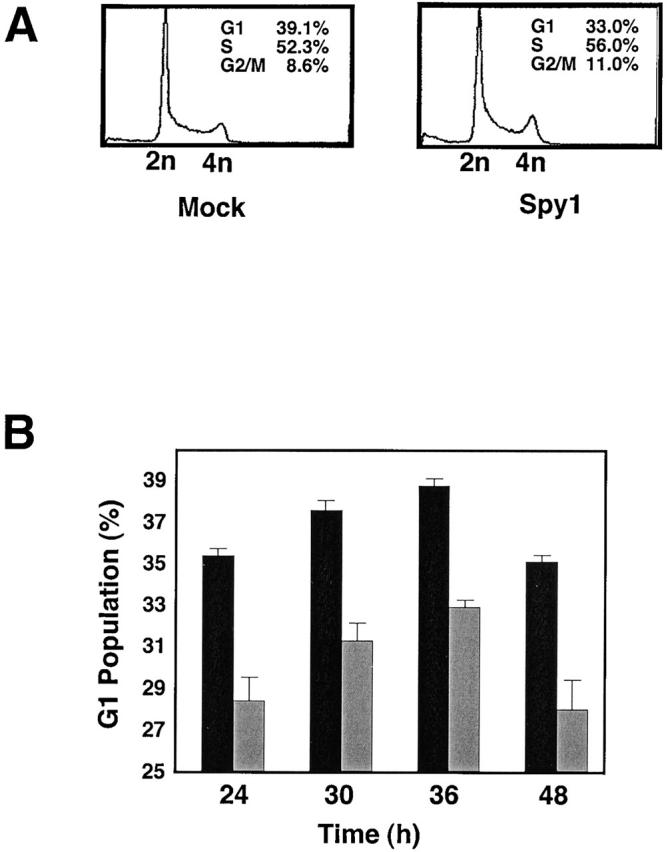
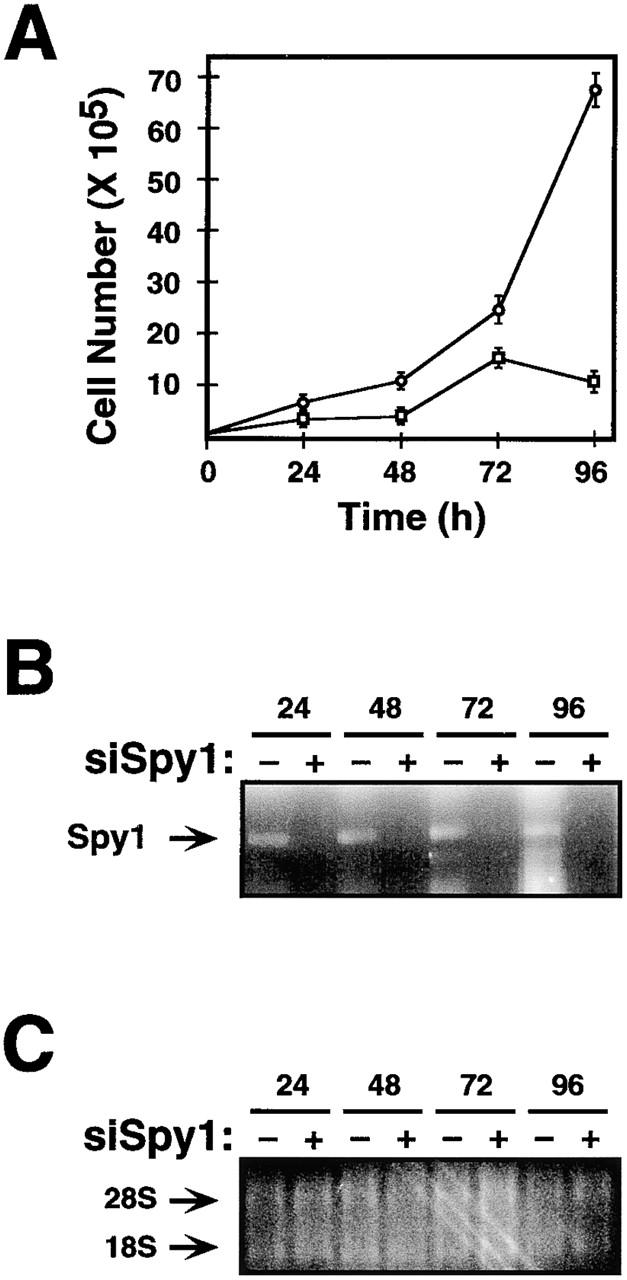
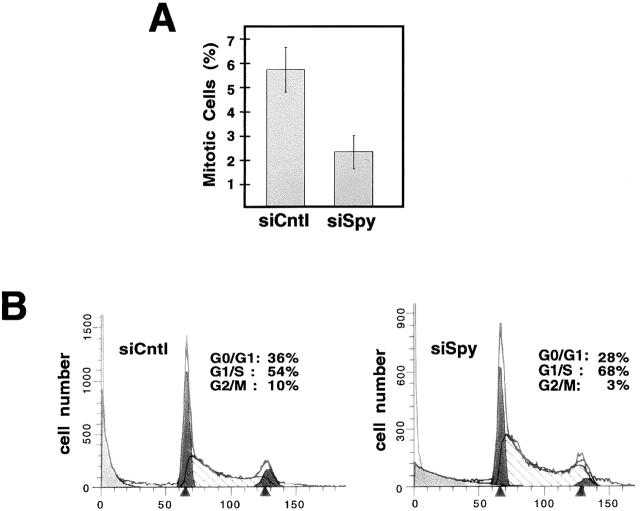
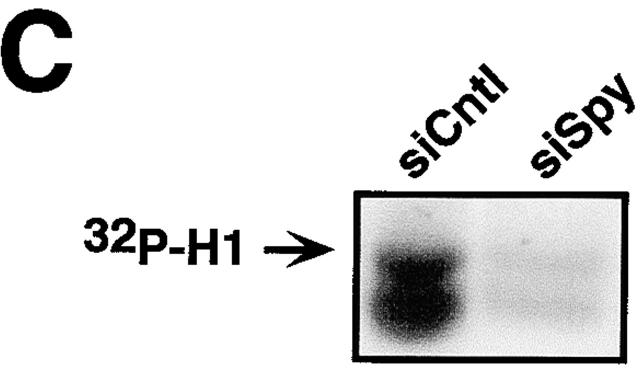
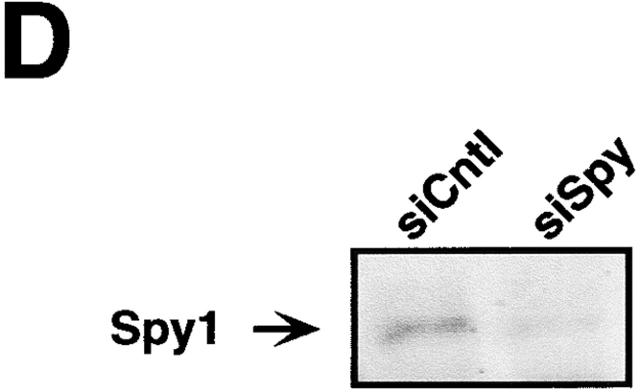
The decision for a cell to self-replicate requires passage from G1 to S phase of the cell cycle and initiation of another round of DNA replication. This commitment is a critical one that is tightly regulated by many parallel pathways. Significantly, these pathways converge to result in activation of the cyclin-dependent kinase, cdk2. It is, therefore, important to understand all the mechanisms regulating cdk2 to determine the molecular basis of cell progression. Here we report the identification and characterization of a novel cell cycle gene, designated Speedy (Spy1). Spy1 is 40% homologous to the Xenopus cell cycle gene, X-Spy1. Similar to its Xenopus counterpart, human Speedy is able to induce oocyte maturation, suggesting similar biological characteristics. Spy1 mRNA is expressed in several human tissues and immortalized cell lines and is only expressed during the G1/S phase of the cell cycle. Overexpression of Spy1 protein demonstrates that Spy1 is nuclear and results in enhanced cell proliferation. In addition, flow cytometry profiles of these cells demonstrate a reduction in G1 population. Changes in cell cycle regulation can be attributed to the ability of Spy1 to bind to and prematurely activate cdk2 independent of cyclin binding. We demonstrate that Spy1-enhanced cell proliferation is dependent on cdk2 activation. Furthermore, abrogation of Spy1 expression, through the use of siRNA, demonstrates that Spy1 is an essential component of cell proliferation pathways. Hence, human Speedy is a novel cell cycle protein capable of promoting cell proliferation through the premature activation of cdk2 at the G1/S phase transition.


Figures

Figure 1.
Figure 1.
Identification of human Spy1. (A) Nucleotide sequence and predicted aa sequence of human Spy1. (B) The alignment of the amino acid sequence of Xenopus Speedy (X-Spy1) is shown in comparison with the human homologue (H-Spy1) and p33ringo (X-Ringo). A potential nuclear export signal sequence and a conserved acidic domain are shaded. The GenBank/EMBL/DDBJ accession no. for human Spy1 is pending.
Figure 2.
Figure 2.
Human Spy1 induces GVBD in Xenopus oocytes. (A) Oocytes were injected with the indicated mRNA, incubated with progesterone (Prog) as a positive control, or injected with H2O as a negative control, and scored for GVBD by the formation of a white spot on the animal pole. This graph is the composite of three independent experiments. (B) Deletion mutants of Xenopus Spy1 define a minimal activation domain of X-Spy1. Oocytes were injected with the indicated mRNA or incubated with progesterone and scored for GVBD. Deletion mutants are missing the following aa: Δ1 (5–53), Δ2 (54–94), Δ3 (98–137), Δ4 (137–170), Δ5 (173–218), and Δ6 (218–268).
Figure 3.
Figure 3.
Human Spy1 mRNA is present in a variety of human tissues and immortalized cell lines. (A) RT-PCR of mRNA from 15 different human tissues. Lane 1 is a negative RT-PCR control containing no mRNA. Lane 2 is a positive RT-PCR control using control RNA with control primers. Human tissue samples are as follows: lane 3, thymus; 4, salivary gland; 5, liver; 6, fetal brain; 7, adrenal gland; 8, bone marrow; 9, fetal liver; 10, lung; 11, skeletal muscle; 12, thyroid; 13, brain/cerebellum; 14, heart; 15, placenta; 16, spleen; 17, trachea. (B) Control formaldehyde gel demonstrating the quality and quantity of the mRNA used in A. (C) RT-PCR of mRNA prepared from Ntera-2 cells (lane 3), 293T cells (lane 4), Spy1-transfected 293T cells (lane 5), and HeLa cells (lane 6). Lanes 1 and 2 are RT-PCR controls with a control mRNA and no mRNA, respectively. (D) Control formaldehyde gel demonstrating the quality and quantity of the mRNA used in C. Lanes 1–4 correspond to lanes 3–6 in C. (E) RT-PCR of mRNA prepared from synchronized 293T cells at various stages of the cell cycle. Lanes 1 and 2 are RT-PCR controls with no mRNA and control mRNA, respectively. (F) Control formaldehyde gel demonstrating the quantity and quality of the mRNA used in E. Lanes 1–5 correspond to lanes 3–7 in E.
Figure 4.
Figure 4.
Human Spy1 binds to and activates cdk2. (A) Indirect immunofluorescence on COS-1 cells transiently transfected with human myc-tagged Spy1 (myc–Spy1; bottom left) or with empty vector (mock; top left) shows myc–Spy1 in the nucleus. The corresponding panels on the right are stained with Hoechst dye to illuminate the nuclei of all the cells present. (B) Coimmunoprecipitation of transiently transfected myc–Spy1 with endogenous cdk2 from 293T cells. Western blot analysis using antibodies against the myc epitope tag (top) or against cdk2 (bottom). Lane 1 is lysate from mock-transfected cells. Lane 2 is lysate from myc–Spy1-transfected cells. Lanes 3 and 4 are immunoprecipitations (IPs) from mock-transfected cells, and lanes 5 and 6 are immunoprecipitations from myc–Spy1-transfected cells using either anti-cdk2 (lanes 3 and 5) or anti-myc (lanes 4 and 6). (C) Top panel shows histone H1 phosphorylation assay. 293T cells were transiently transfected with empty vector (mock) or myc–Spy1. 24 h after transfection, cells were harvested and immunoprecipitated with antibodies against cdk2. Lane 1 is histone H1 alone (no IP). Lanes 2 (mock) and 3 (myc–Spy1) are cdk2 IPs. Bottom panel shows blot of cdk2 in IPs from mock and myc–Spy1 cells. (D) Top panel shows histone H1 phosphorylation assay. 293T cells were transiently transfected with empty vector (mock) (lane 1) or myc–Spy1 (lane 2). 24 h after transfection, cells were harvested and immunoprecipitated with antibodies against cdc2. Coomassie blue staining showing equal loading of cdc2 is presented in the bottom panel.
Figure 4.
Figure 4.
Human Spy1 binds to and activates cdk2. (A) Indirect immunofluorescence on COS-1 cells transiently transfected with human myc-tagged Spy1 (myc–Spy1; bottom left) or with empty vector (mock; top left) shows myc–Spy1 in the nucleus. The corresponding panels on the right are stained with Hoechst dye to illuminate the nuclei of all the cells present. (B) Coimmunoprecipitation of transiently transfected myc–Spy1 with endogenous cdk2 from 293T cells. Western blot analysis using antibodies against the myc epitope tag (top) or against cdk2 (bottom). Lane 1 is lysate from mock-transfected cells. Lane 2 is lysate from myc–Spy1-transfected cells. Lanes 3 and 4 are immunoprecipitations (IPs) from mock-transfected cells, and lanes 5 and 6 are immunoprecipitations from myc–Spy1-transfected cells using either anti-cdk2 (lanes 3 and 5) or anti-myc (lanes 4 and 6). (C) Top panel shows histone H1 phosphorylation assay. 293T cells were transiently transfected with empty vector (mock) or myc–Spy1. 24 h after transfection, cells were harvested and immunoprecipitated with antibodies against cdk2. Lane 1 is histone H1 alone (no IP). Lanes 2 (mock) and 3 (myc–Spy1) are cdk2 IPs. Bottom panel shows blot of cdk2 in IPs from mock and myc–Spy1 cells. (D) Top panel shows histone H1 phosphorylation assay. 293T cells were transiently transfected with empty vector (mock) (lane 1) or myc–Spy1 (lane 2). 24 h after transfection, cells were harvested and immunoprecipitated with antibodies against cdc2. Coomassie blue staining showing equal loading of cdc2 is presented in the bottom panel.
Figure 5.
Figure 5.
Expression of Spy1 increases the rate of proliferation of mammalian cells. Growth curves of (A) HeLa cells, (B) NIH3T3 cells, and (C) Ntera-2 cells. All cells were transiently transfected with myc–Spy1 (□) or empty vector (○). Cells were collected in triplicate at the indicated time point and counted via trypan blue exclusion. The graph is one representative experiment of at least three independent experiments. Error bars were calculated using SEM.
Figure 5.
Figure 5.
Expression of Spy1 increases the rate of proliferation of mammalian cells. Growth curves of (A) HeLa cells, (B) NIH3T3 cells, and (C) Ntera-2 cells. All cells were transiently transfected with myc–Spy1 (□) or empty vector (○). Cells were collected in triplicate at the indicated time point and counted via trypan blue exclusion. The graph is one representative experiment of at least three independent experiments. Error bars were calculated using SEM.
Figure 6.
Figure 6.
Expression of Spy1 increases both the rate of cell replication and division. (A) Growth curve of 293T cells transiently transfected with myc–Spy1 (□) or empty vector (○). Cells were collected at the indicated times, counted on a Coulter counter, and replated. The graph is the average of three independent experiments. Error bars were calculated using SEM. (B) Increase of BrdU incorporation in myc–Spy1-transfected 293T cells. Cells were harvested at day 2, stained for BrdU, and the positive cells were counted via fluorescence microscopy. Error bars represent the standard error of three experiments. (C) MTT analysis of 293T cells expressing myc–Spy1 (□) or empty vector (○). Cells were collected at the indicated times, treated, and then the absorbance was taken at 570 nm to determine the relative levels of MTT. Bars represent the standard error between four separate transfections within one representative experiment. (D) Histone H3 phosphorylation in myc–Spy1-transfected 293T cells. Cells were harvested at day 2, stained for phosphorylated histone H3, and the positive cells were counted via fluorescence microscopy. Bars represent the standard error of three separate experiments.
Figure 6.
Figure 6.
Expression of Spy1 increases both the rate of cell replication and division. (A) Growth curve of 293T cells transiently transfected with myc–Spy1 (□) or empty vector (○). Cells were collected at the indicated times, counted on a Coulter counter, and replated. The graph is the average of three independent experiments. Error bars were calculated using SEM. (B) Increase of BrdU incorporation in myc–Spy1-transfected 293T cells. Cells were harvested at day 2, stained for BrdU, and the positive cells were counted via fluorescence microscopy. Error bars represent the standard error of three experiments. (C) MTT analysis of 293T cells expressing myc–Spy1 (□) or empty vector (○). Cells were collected at the indicated times, treated, and then the absorbance was taken at 570 nm to determine the relative levels of MTT. Bars represent the standard error between four separate transfections within one representative experiment. (D) Histone H3 phosphorylation in myc–Spy1-transfected 293T cells. Cells were harvested at day 2, stained for phosphorylated histone H3, and the positive cells were counted via fluorescence microscopy. Bars represent the standard error of three separate experiments.
Figure 7.
Figure 7.
Spy1-enhanced growth is dependent on cdk2 activation. (A) Growth curve of 293T cells transiently transfected with Spy1 (□); mock (⋄); Spy1 + dncdk2 (cdk2D145N) (Δ); mock + dncdk2 (X); Spy1 + 7 μM olomoucine (); mock + 7 μM olomoucine (○). Error bars represent the SEM between triplicate plates of one representative experiment. This experiment was repeated three times. (B) Western blot of lysates from each sample at 96 h. The blot was then probed for myc–Spy1 expression.
Figure 8.
Figure 8.
Speedy increases cell division and decreases the G1 population. 293T cells were transiently transfected with empty vector or myc–Spy1. Cells were collected 24, 30, 36, and 48 h after transfection and analyzed by flow cytometry. (A) A representative FACS® profile of cells overexpressing empty vector (mock) or myc–Spy1. (B) Graphic representation of the percentage of cells in G1 phase. Mock, black bars; myc–Spy1, gray bars. Error bars represent the SEM of four independent experiments.
Figure 9.
Figure 9.
Endogenous Spy1 is required for normal cell growth. Spy1 RNA was depleted using RNA interference. (A) 293T cells were transiently transfected with siRNA directed against Spy1 (siSpy) (□) or siluc-GL2 control (siCntl) oligonucleotides (○). 24 h after transfection, triplicate plates were counted by trypan blue exclusion. The surviving cell number was graphed as an average of three plates (±SEM). (B) mRNA was isolated from remaining cells from each time point and was subjected to RT-PCR analysis. Lanes indicated with a plus have been treated with siSpy, and lanes indicated with a minus have been treated with siCntl. (C) Control 1.2% agarose formaldehyde gel demonstrating the quantity and quality of the mRNA used in B.
Figure 10.
Figure 10.
Depletion of Spy1 protein decreases cdk2-associated kinase activity and slows movement of cells into M phase of the cell cycle. (A) Mitotic index of cells expressing siSpy or siluc-GL2 (siCntl) 72 h after transfection. Error bars represent the average of three separate transfections. This is one representative experiment of three. (B) FACS® analysis of siSpy- and siCntl-expressing cells 72 h after transfection. Data were analyzed by M-cycle. One representative experiment of three is shown. (C) Cdk2-associated histone kinase activity was measured for cells transfected for 72 h with siSpy and siCntl. Data were quantitated using NIH Image 1.62. Similar alterations in kinase activity are observed over a range of time points. (D) Western blot control demonstrating that endogenous Spy1 protein is depleted 72 h after transfection of siSpy siRNA.
Figure 10.
Figure 10.
Depletion of Spy1 protein decreases cdk2-associated kinase activity and slows movement of cells into M phase of the cell cycle. (A) Mitotic index of cells expressing siSpy or siluc-GL2 (siCntl) 72 h after transfection. Error bars represent the average of three separate transfections. This is one representative experiment of three. (B) FACS® analysis of siSpy- and siCntl-expressing cells 72 h after transfection. Data were analyzed by M-cycle. One representative experiment of three is shown. (C) Cdk2-associated histone kinase activity was measured for cells transfected for 72 h with siSpy and siCntl. Data were quantitated using NIH Image 1.62. Similar alterations in kinase activity are observed over a range of time points. (D) Western blot control demonstrating that endogenous Spy1 protein is depleted 72 h after transfection of siSpy siRNA.

Similar articles

Cited by

References

    1. Bartek, J., J. Bartkova, and J. Lukas. 1996. The retinoblastoma protein pathway and the restriction point. Curr. Opin. Cell Biol. 8:805–814. - PubMed
    1. Beier, R., A. Burgin, A. Kiermaier, M. Fero, H. Karsunky, R. Saffrich, T. Moroy, W. Ansorge, J. Roberts, and M. Eilers. 2000. Induction of cyclin E-cdk2 kinase activity, E2F-dependent transcription and cell growth by Myc are genetically separable events. EMBO J. 19:5813–5823. - PMC - PubMed
    1. Chen, C., and H. Okayama. 1987. High-efficency transformation of mammalian cells by plasmid DNA. Mol. Cell. Biol. 7:2745–2752. - PMC - PubMed
    1. Ekholm, S.V., and S.I. Reed. 2000. Regulation of G(1) cyclin dependent kinases in the mammalian cell cycle. Curr. Opin. Cell Biol. 12:676–684. - PubMed
    1. Fang, F., and J.W. Newport. 1991. Evidence that the G1-S and G2-M transitions are controlled by different cdc2 proteins in higher eukaryotes. Cell. 66:731–742. - PubMed

Publication types

MeSH terms